⚠️ This extension is under active development. Frequent changes and updates are expected.
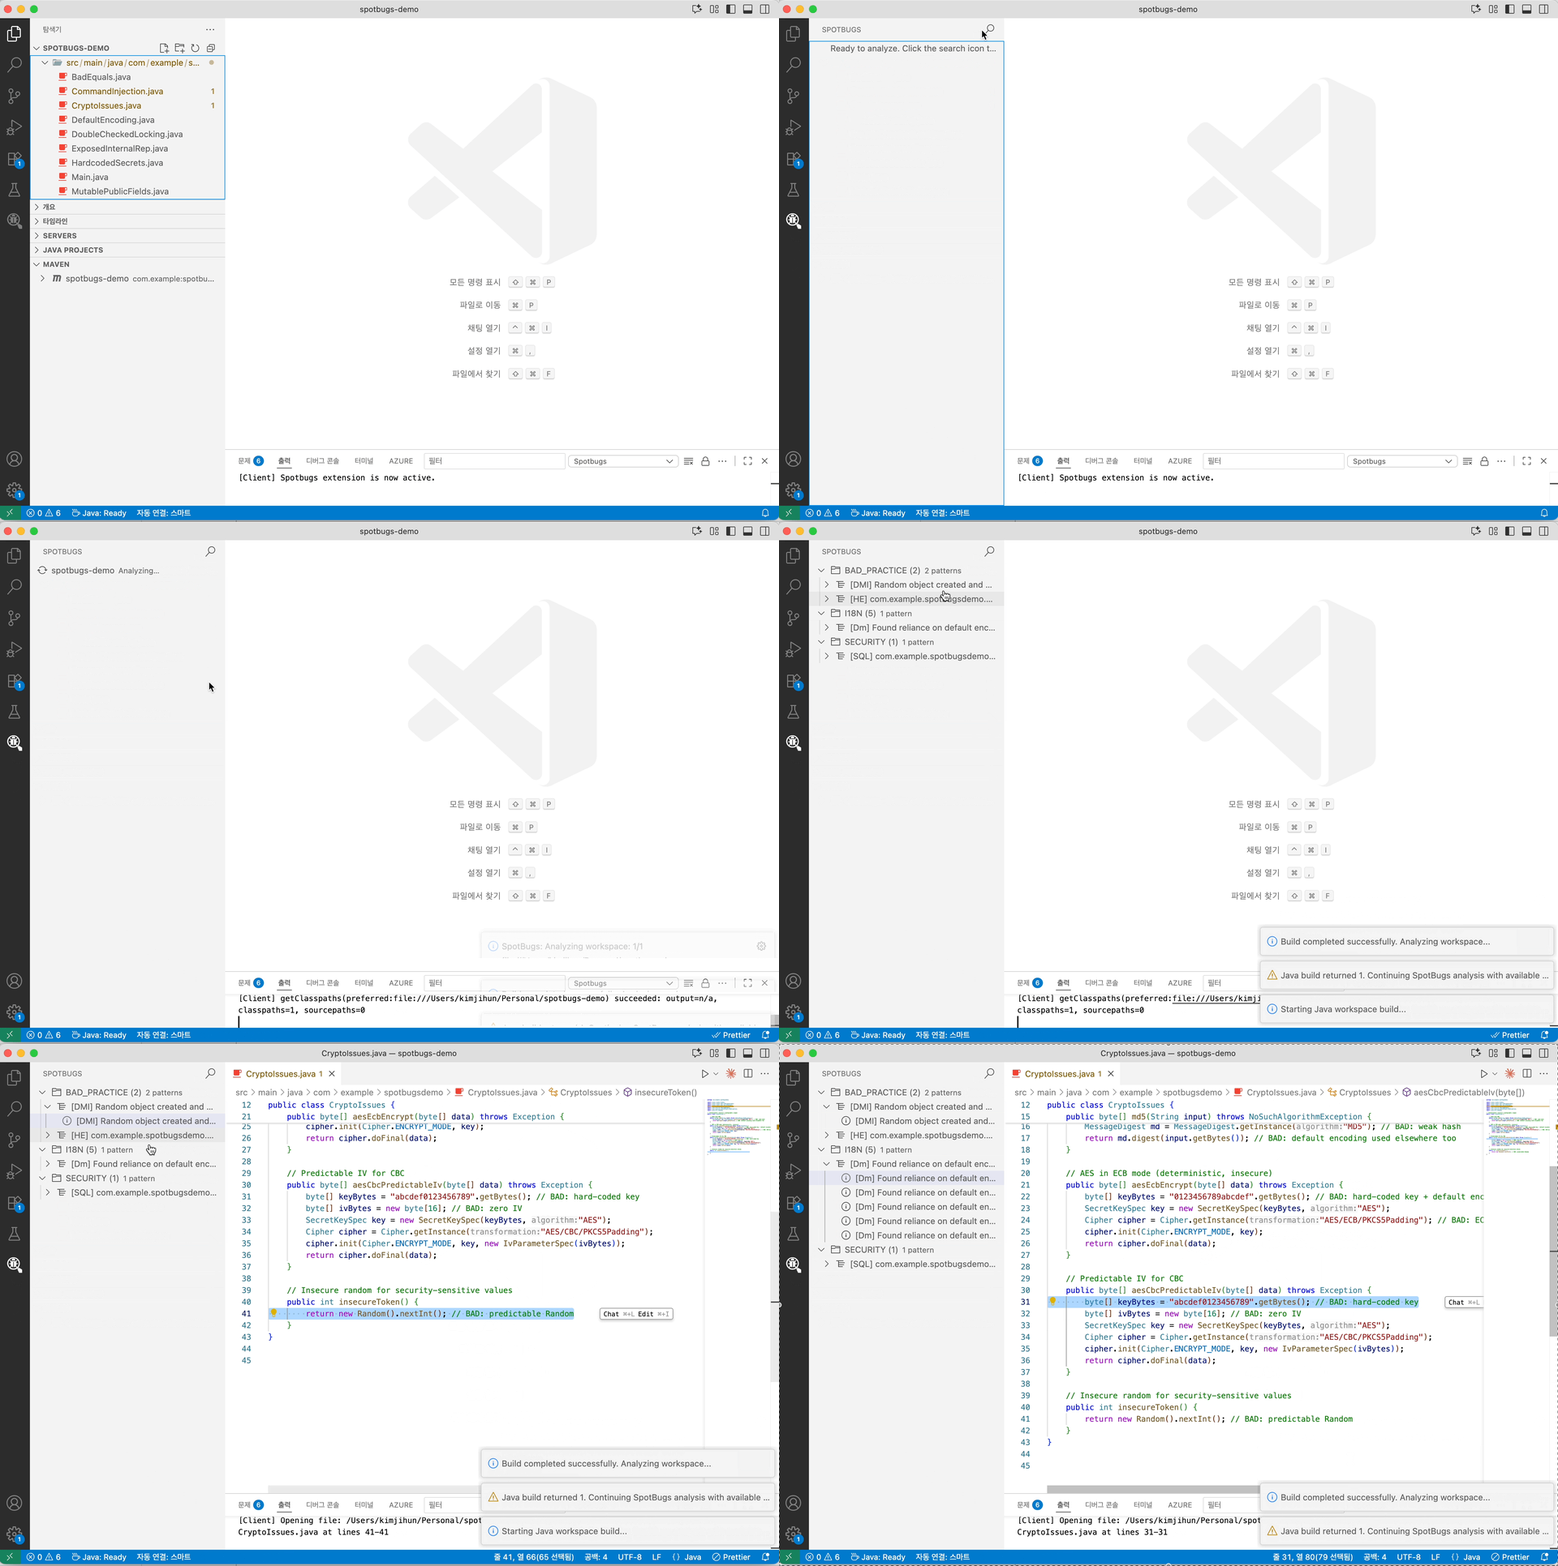
Analyze Java code with SpotBugs directly in VS Code. View findings in a dedicated tree view, jump to offending lines, and track issues with VS Code diagnostics.
- Analyze a single file or an entire workspace (Maven/Gradle projects)
- Group findings by category and pattern with severity icons
- Navigate to bug locations in source files with matching diagnostics/squiggles
- Export filtered findings to SARIF for code scanning tools
- Java 11 or later (JDK)
- VS Code extension: “Language Support for Java by Red Hat” (redhat.java)
- Open a Java project folder in VS Code
- Run a command:
- “SpotBugs: Analyze this workspace” (
spotbugs.runWorkspace) - “SpotBugs: Analyze File/Folder” (context menu,
spotbugs.run)
- “SpotBugs: Analyze this workspace” (
- Review results in the “SpotBugs” view (Activity Bar)
SpotBugs: Analyze File/Folder— Analyze selected file or folderSpotBugs: Analyze this workspace— Build then analyze all projects in the workspaceSpotBugs: Export SpotBugs Findings (SARIF)— Save current findings to a SARIF reportSpotBugs: Reset SpotBugs Results— Clear the SpotBugs view and diagnostics
spotbugs.analysis.effort: SpotBugs effort level (min,default,max). Default:default.spotbugs.analysis.priorityThreshold: Report bugs with rank less than or equal to this value (1 = most severe, 20 = least). Default:9.


