Group your data visually!
This script colorizes and thickens borders of Excel rows based on one or more columns.
- Copy the code
- Open your document
- Press
Alt+F11(Fn+F11on Mac) to open VBA Editor - Open desired sheet's code
- Paste the code
Now you can save your document as Excel Macro-Enabled Workbook (*.xlsm) format to use it later.
- Sort your table based on intended columns
- Determine columns in the script (See next title)
- (Optional) Select entire sheet or table and from
Hometab, click onBordersdrop-down and selectAll Borders - Press
Alt+F8(Fn+F8on Mac) to open Macro dialog box - Select
[YourSheet].Colorizeand click Run
You can make some configurations by pressing Alt+F11 (Fn+F11 on Mac) and editing respective part of the code:
Cols: For example, writeCols = [{5, 6}]to colorize based on columns 5 and 6 and writeCols = [{1}]to colorize only based on first column.HeaderRowsCount: Number of rows at the header to exclude from colorizing, default:1.UseColor,UseBorder(True/False): Restrict function of the script, default:True.BreakRows(True/False): Breaks page at columns' change, default:False.AddHeaderCols(True/False): Adds columns' caption at the beginning of each group, default:False.fixed,random,InANewRow,Delimiter,ChangeStyle,InCol: Detailed configurations.
(Sample data from contextures.com)
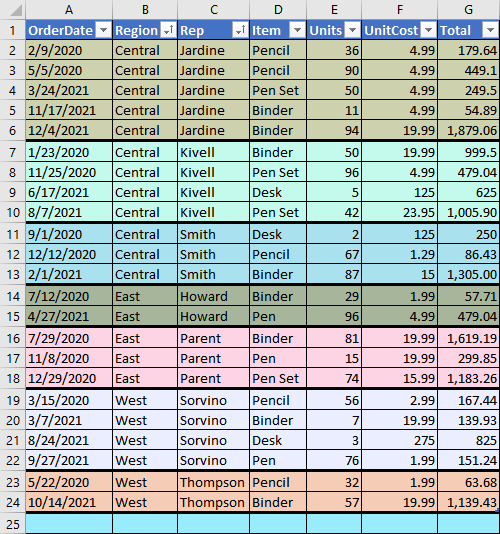
In example above, rows are sorted based on columns 2 and 3 and then, colorizing took place on same columns.
Configuration: Cols = [{2, 3}]
Page break preview:
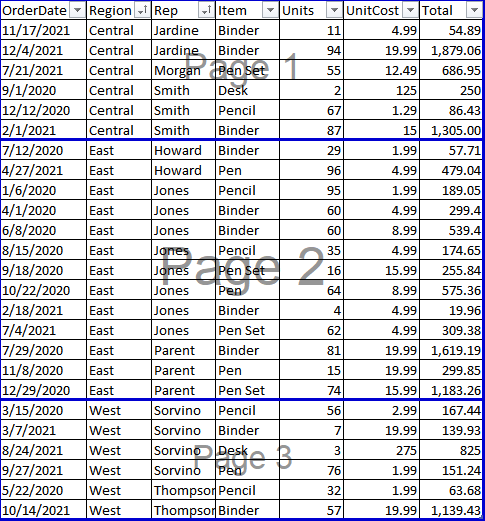
Configuration:
Cols = [{2}]

UseColor = False
UseBorder = False
BreakRows = TruePage break preview:
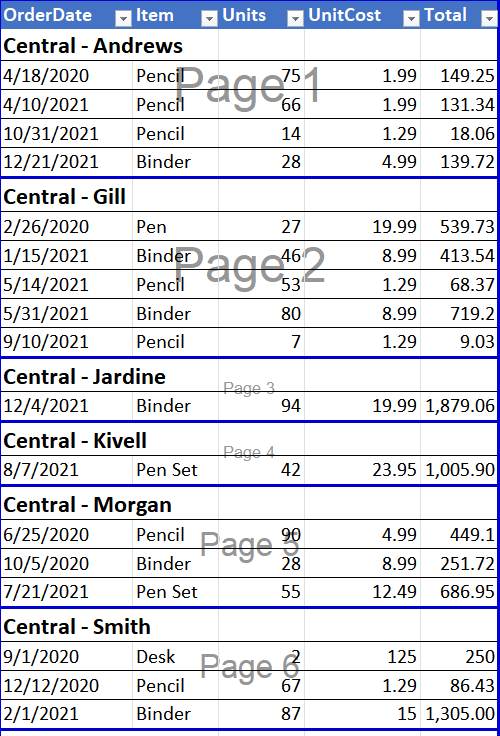
Configuration (Also made cols 2 and 3 hidden):
Cols = [{2, 3}]

UseColor = False
BreakRows = True
AddHeaderCols = True