Simple script for plotting .agr (Grace) files created with VMD (Visual Molecular Dynamics). Allows export to csv/svg/png.
VMD allows generation of .agr files which are no longer properly interpreted by xmgrace software. This small tool allows to quickly plot data from an agr file (using matplotlib underneath) or to export the data to other formats.
./plot.py example.agr -t 'Energy of Topoisomerase I' -x 'Time (ns)' -y 'Energy (kcal/mol)' -l 1 0.6 -s 0.005 1 -e png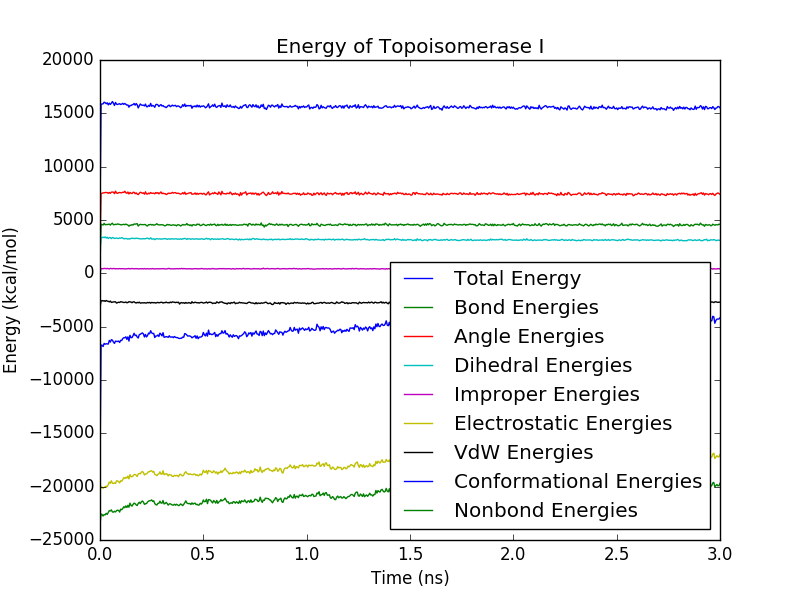
Python 3.5 is required. You can download the code from repository, for example with:
git clone https://github.com/krassowski/vmd-agr-parser
cd vmd-agr-parser
If you want to create plots matplotlib will be required:
pip3 install --user matplotlibIf it does not work, look at How to get pip? section.
Plot from file:
./plot.py example.agrExport to csv (no matplotlib required):
./plot.py example.agr --export csv --do_not_plotPlot and export to svg:
./plot.py example.agr --export svgRestrict to only one variable and change legend position:
./plot.py example.agr --restrict_to 'Total Energy' --legend_position 1 0.12Set title and axes names:
./plot.py example.agr --title 'Energy of Topoisomerase I in complex with SRSF6' -x 'Simulation frame' -y 'Energy (kcal/mol)'Rescale plot axes so units can be shown:
./plot.py example.agr --scale 0.005 1 -x 'Time (ns)'Use custom labels in legend:
./plot.py example.agr --restrict_to 'Total Energy' 'Bond Energies' --labels 'Total energy (includes vdW)' 'Bond energies'./plot.py example.agr -husage: plot.py [-h] [--do_not_plot] [-t TITLE] [-x AXIS_X] [-y AXIS_Y]
[-r RESTRICT_TO [RESTRICT_TO ...]] [-e {csv,svg,png,jpg}]
[-s SCALE SCALE] [-l LEGEND_POSITION LEGEND_POSITION]
[--labels LABELS [LABELS ...]]
input_fileIf you do not have pip3, try python3 -m pip or just pip.
Some Linux distributions have package named like python3-pip.
If everything fails, you can install pip with:
wget https://bootstrap.pypa.io/get-pip.py && python3 get-pip.py --user