analyzing travel trends of people who are living alone(pla) and clustering with main features using ML
- Expansion of social and economic influence of single-person households -> Single-person households are rapidly emerging as a new consumer 1인가구의 사회, 경제적 영행력 확대 -> 1인가구가 새로운 소비 주체로 급부상
- Through the analysis of travel status and clustering of single-person households, it is intended to find out the travel patterns of single-person households and the characteristics of each cluster. 1인 가구의 여행 실태 분석과 군집화를 통해 1인가구 만의 여행 패턴 및 군집별 특징을 알아보고자 함.
National Travel Survey 2019 by Ministry of Culture, Sports and Tourism 국민여행조사 2019 by 문화체육관광부
 [조사개요]
• 조사목적 : 우리나라 국민의 여행실태를 종합적으로 파악, 국가 관광에 관한 정책 수립과 연구분석 등을 위한 기초 자료를 제공
• 조사주기 : 반기(6개월)
• 조사대상 : 전국 만 15세 이상의 가구 원
• 조사기간 : 조사 대상 년도 7~8월 (상반기) 조사 대상 년도 익년 1~2월 (하반기)
• 조사방법 : 확률표본, 면접조사
-
Filter only single-person household data 1인 가구 데이터만 필터링
For single-person household traveler analysis, filter only the data where the number of household members living together is 1 1인가구 여행자 분석을 위해 "동거가구원수" 가 1인 인 데이터만 필터링
-
Selection of key features _ 9 in total (selection criteria: 3 types of demographic characteristics data and 6 types of travel type data) 주요 피쳐 선택 _ 총 9개 (선택 기준: 인구학적 특성데이터 3가지 및 여행유형데이터 6가지 )
Select 9 variables that are considered to be able to categorize traveler patterns among various survey responses of raw data. Consists of demographically specific data such as age and gender, and data showing travel types such as reasons for selecting travel destinations and major travel types. 로우 데이터의 다양한 설문응답 중 여행자 패턴을 유형화 할 수 있을 것 이라 판단되는 변수 9개 선택. 연령, 성별 등 인구학적특정 데이터와 여행지 선정이유, 주요여행유형 등 여행유형을 보여주는 데이터 로 구성.
- DQ6A : 6_월 평균 소득_본인 소득 (소득없음 1~ 12까지)
- BSEX : 성별
- BAGE : 연령
- A2_1~3 : 여행지선택이유 1-3순위
- A3 1~21 : 여행활동유형
- D_TRA"N"_ONE_COST : 여행N차 1인지출비용
- A12 : 국내여행 전반적만족도 (1~5 불만~만족)
- DQ5AC : 주당평균근로시간
- A5_1 ~ 3 : 교통수단
- 여행활동유형
- Type of travel activity : 21 items consolidated into 4 types 21가지 항목을 4가지 유형으로 통합 (1. Rest / recreation tour 2. Gourmet/shopping tour 3. Leisure tour 4. Sightseeing tour) (1. 휴식 / 휴양 관광 2. 식도락/쇼핑관광 3. 레저 관광 4. 볼거리관광)
- Type of travel companion 여행동반자 유형
- Consolidate 7 items into 3 types 7가지 항목을 3가지 유형으로 통합 (1. Family 2. Friends, Lovers 3. Others) (1. 가족 2. 친구, 연인 3. 기타)
- Accommodation type 숙박유형
- Consolidate 14 items into 3 types 14가지 항목을 3가지 유형으로 통합 (1. Camping, 2. Accommodation 3. Staying overnight) (1. 야영, 2. 숙박업체 3.무박)
- Transportation 교통수단
- 11 items integrated into 3 types 11가지 항목 3가지 유형으로 통합 (1. Car 2. Public transportation, 3. Others) (1. 차 2. 대중교통, 3. 기타)
- Travel Destination Selection Criteria 여행지 선청기준
- Filter by most important ranking in order of 1st to 3rd place 1~3위 순으로 가장 중요한 순위로 필터링
Since the type of response overlaps with other features, only 4 meaningful items are selected, and if a response other than that is given, it is treated as no response. And integrating ranks 1, 2, and 3 to leave only the highest rank. 응답의 종류가 다른 피쳐와 겹치는 부분이 많아서 유의미한 항목 4개만 추리고 이외의 응답을 한 경우 응답없음으로 처리해줌. 그리고 1, 2, 3 순위 를 통합해 최상순위 하나만 남겨줌
- Travel expenses 여행지출비용
- Divide into equal numbers and categorize 동일개수로 나누어 범주화
Rawdata was listed as expenditure. Scope it with qcut. rawdata는 지출액으로 나와있었음. 이를 qcut으로 범위화해줌.
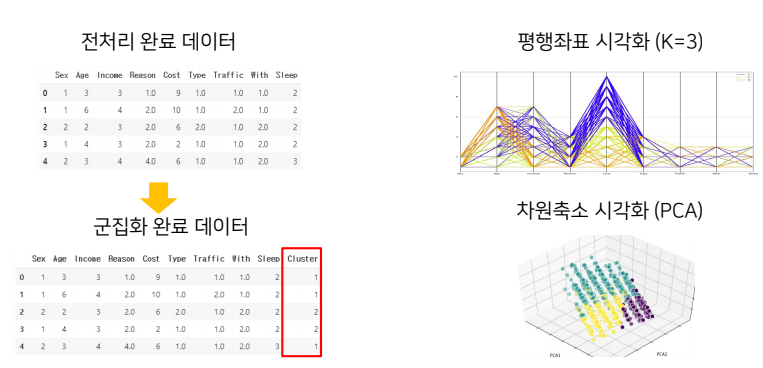
Since it was a survey, there were many missing values than expected. (3000 out of 6800 data in severe cases) Therefore, instead of randomly entering values, we decided to use machine learning to predict and fill in missing values. 설문조사 이다보니 결측치가 예상외로 많이 있었음. (심한경우 6800개의 데이터 중 3000개) 따라서 임의로 값을 넣어주는 대신 머신러닝을 활용해서 결측치를 예측해 채워주기로 함.
Predict missing values of travel pattern data using machine learning based on demographic specific data without missing values 결측치가 없는 인구학적 특정 데이터를 기준으로 머신러닝을 활용해 여행패턴데이터의 결측치 예측
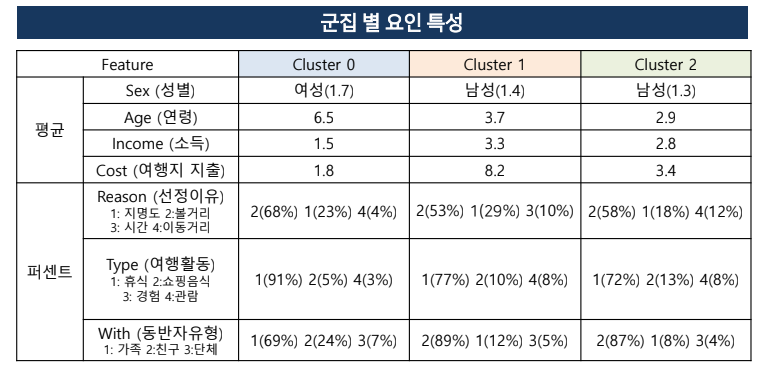
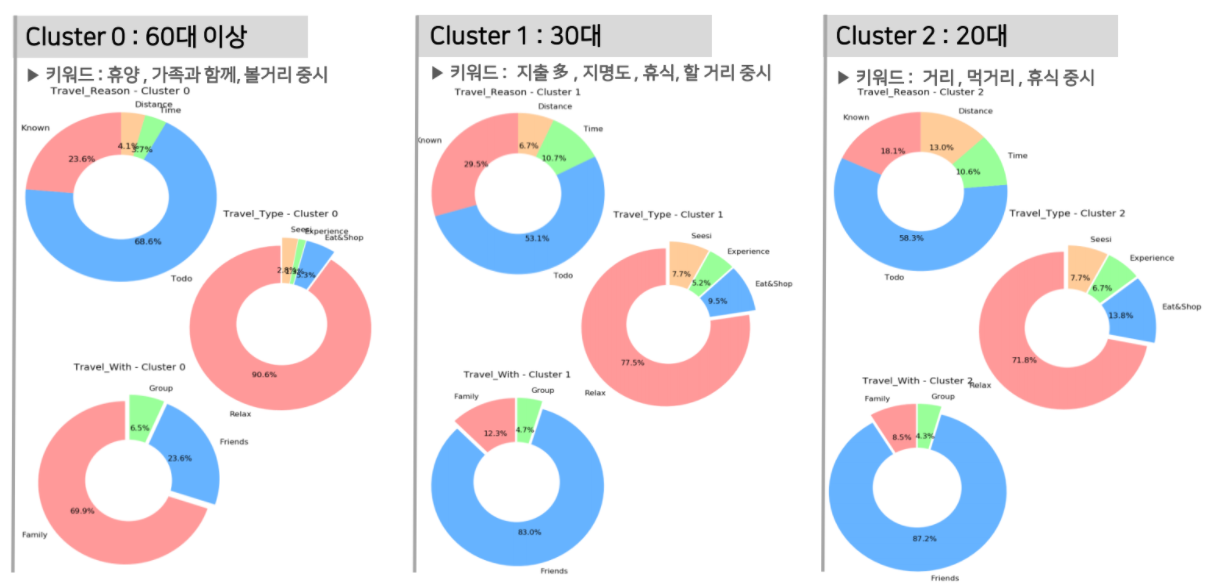
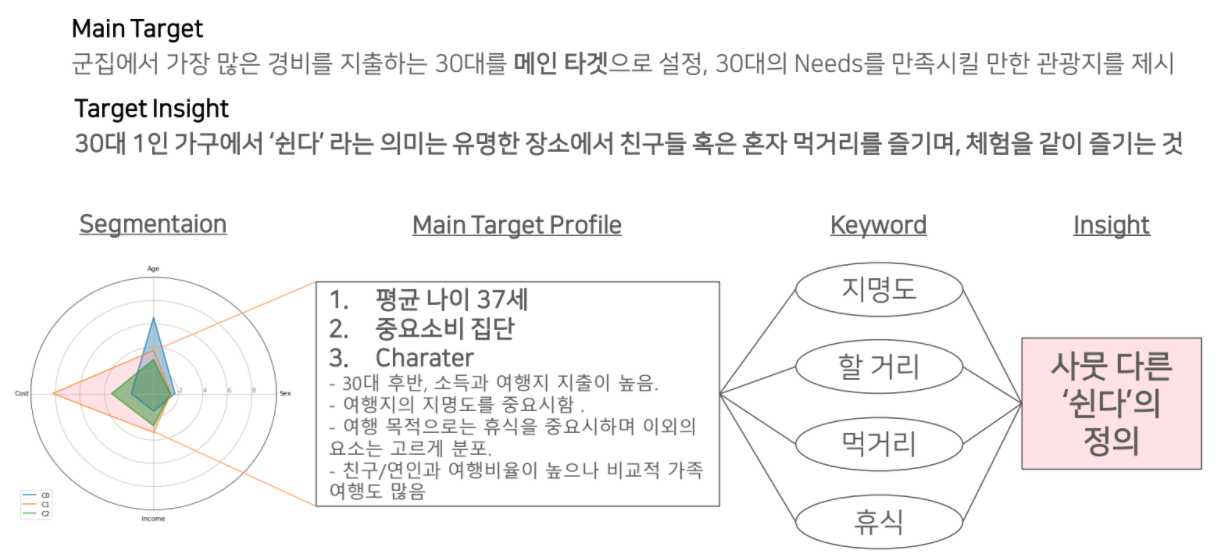
Clustered into a total of 3 clusters 총 3개의 군집으로 군집화
-
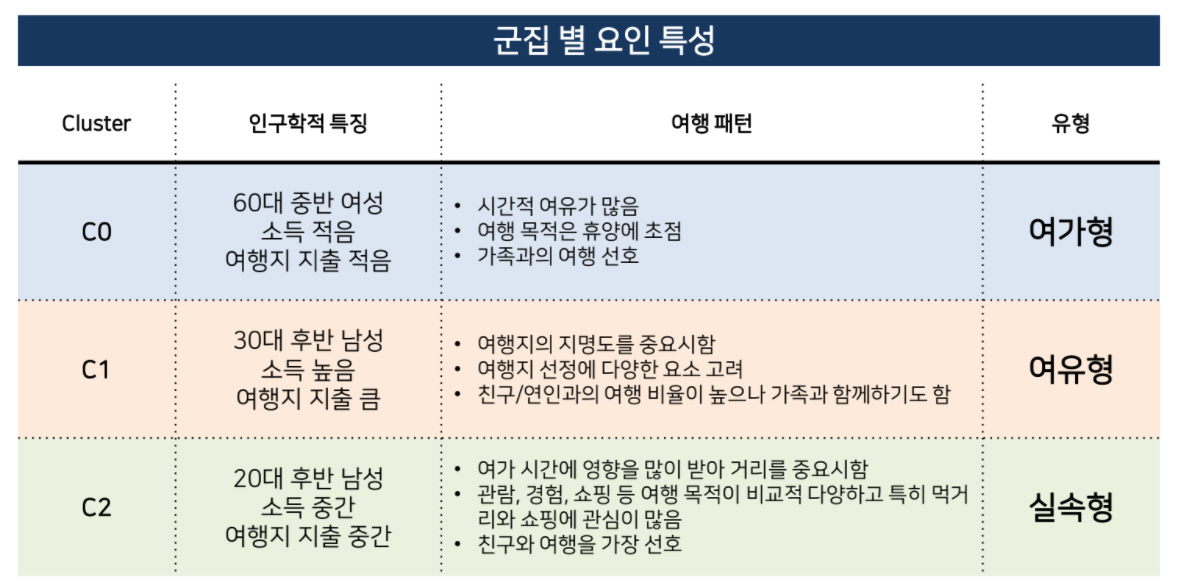
Classify (cluster) the travel patterns of single-person household data into detailed types and analyze the characteristics of each type.
-
To derive insights that help improve tourist destinations and tourism programs.
-
I was able to practice unsupervised learning clustering
-
The process of finding meaning after analyzing and visualizing data in various ways was interesting.
-
There were many missing values in the original data, which made it difficult to use.
-
1인 가구 데이터의 여행 패턴을 세부 유형으로 분류(군집화)하고 유형별 특정을 분석함.
-
관광지와 관광 프로그램 개선에 도움이 되는 인사이트를 도출하고자 함.
-
비지도학습 군집화 실습할 수 있었음
-
데이터를 다양한 방법으로 분석하고 시각화 한 후 의미를 찾아내는 과정이 흥미로웠음
-
원본 데이터에 결측치가 많아 활용에 아쉬운 부분이 있었음