- Use Case
- Business Understanding:
- Retail
- Data Understanding:
- Data of Retail Transaction from 01 December 2010 to 09 December 2011
- 8 columns and 541K records
- Data Preparation:
- Python version: 3.9.0
- Packages used: Pandas, Numpy, Matplotlib, Seaborn, Sklearn, and Feature Engine
- Data Cleaning:
- Removing Null values
- Removing records with -ve unit pricings and quantities R
- Restricting the data to the majority of customers to get influential insights.
- Exploratory Data Analysis:
- Sales of products month by month
- Spending habits of customers
- Revenue generated
- Data Modeling:
- RFM Quantiles
- Evaluation:
- K-Means Clustering - Using Davies Bouldin Score to evaluate clustering algorithms
- Recommendation:
- Up-selling, Reactivation and Retention strategies
-
Get a business insight into how many products are sold every month.
-
Get a business insight into how many customers spend their money every month.
-
To reduce risk in deciding where, when, how, and to whom a product, service, or brand will be marketed.
-
To increase marketing efficiency by directing effort specifically toward the designated segment in a manner consistent with that segment’s characteristics.
-
The large size of data, can not maintain by an excel spreadsheet.
-
Need several coordination from each department.
-
Demography data have a lot of missing values and typos.
-
Descriptive Analysis
-
Graph Analysis
-
Segment Analysis
-
Helping Business Development Team to create product differentiation based on the characteristic of each customer.
-
Know how to treat the customer with specific criteria.
-
Know how many products sold every month.
-
Know how many customers spend their money every month.
-
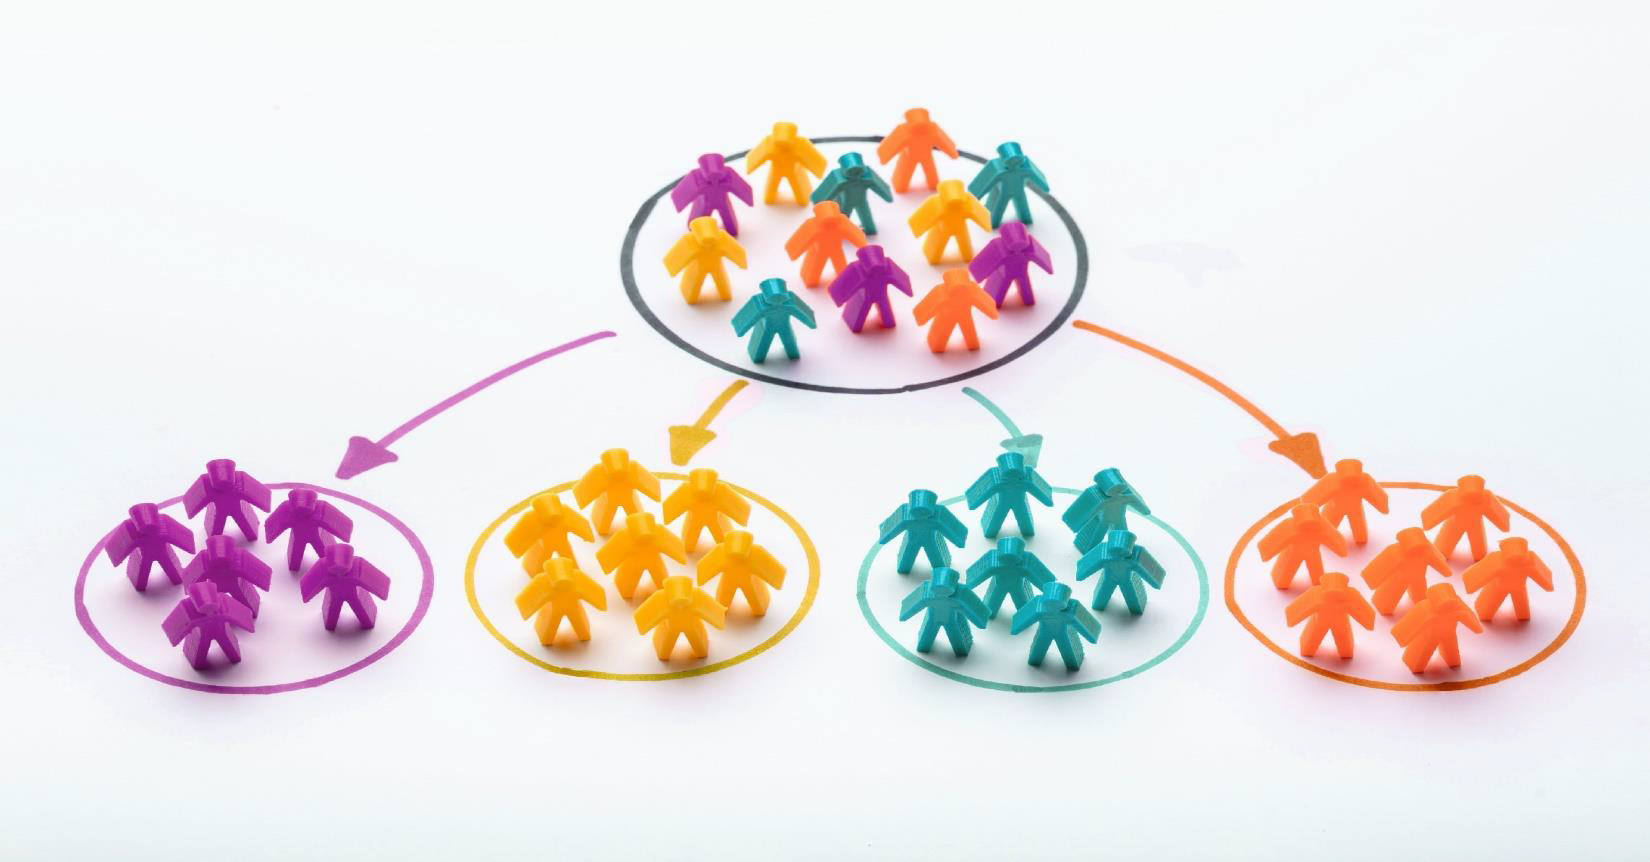
Customer segmentation analysis.
-
Recommendation based on customer segmentation.