This project is a minimal, interactive data exploration tool built using Streamlit, Plotly, and Pandas. It allows users to visualize and compare key socio-economic indicators of Indian districts using the Census 2011 dataset.
The app provides:
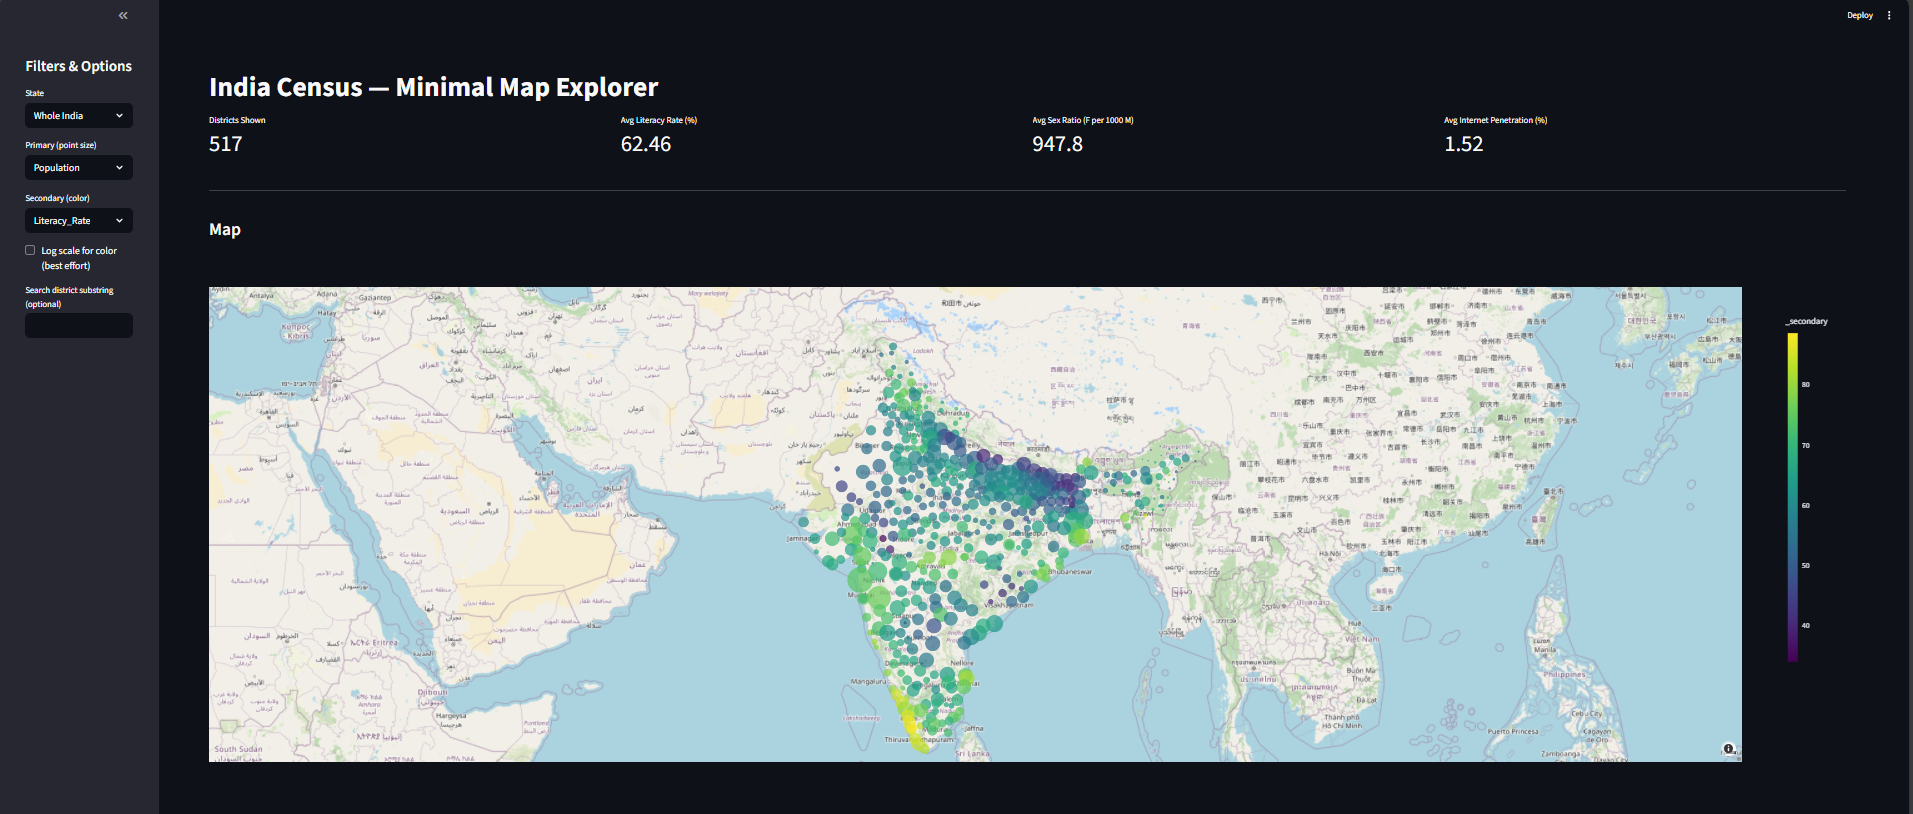
- 🎯 District-level interactive map
- 🧮 Summary metrics (literacy, sex ratio, penetration rates)
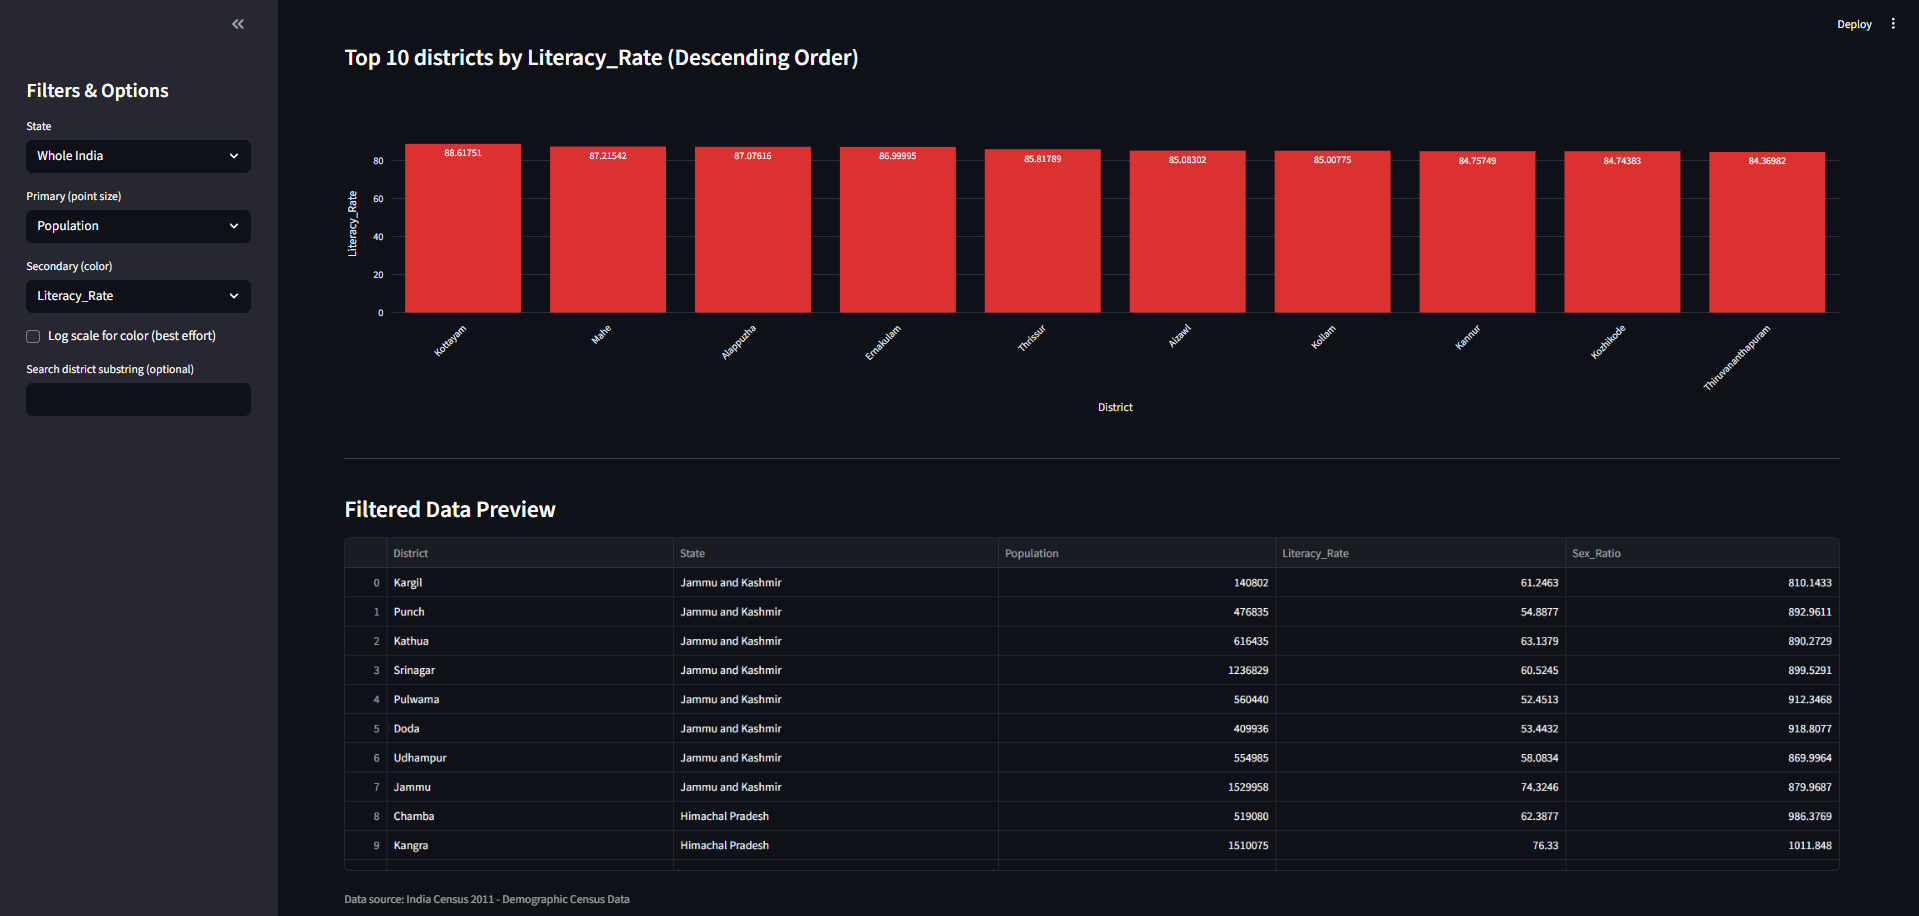
- 📊 Top-districts bar chart
- 🔎 Clean filter/search interface
- 📄 Data preview table
- Plotly Mapbox scatter map
- Adjustable point size and color based on census metrics
- Hover tooltips showing selected district details
- Beautiful color scales (
Viridis,Plasma)
- View all India or filter by state
- Select primary (size) and secondary (color) metrics
- Search any district by name
- Optional log-scale coloring
Shows the highest values for the chosen metric (descending order). Helpful for identifying best-performing districts.
Displays the filtered dataset Useful for quick verification and exploring exact numeric values.
- Sex Ratio (Females per 1000 Males)
- Internet Penetration % (computed if missing)
📁 mini_proj/
│── app.py
│── README.md
│── final_india.csv
This app uses a cleaned version of District-Level India Census 2011 containing:
- Population, Male, Female
- SC / ST population
- Literate population (Male/Female)
- Literacy Rate (%)
- Electricity, Internet, Computer
- LPG/PNG availability
- Bathroom / Toilet availability
- Bicycle, Car, Two-Wheeler
- Phone, TV
- 0–29
- 30–49
- 50+
- Latitude
- Longitude
- Sex_Ratio
- Internet_Penetration
git clone https://github.com/cursed027/India-Census-Map-Explorer/
cd india-census-map-explorerpip install streamlit pandas numpy plotlystreamlit run app.pyStreamlit will open automatically, or visit:
http://localhost:8501
The CSV is automatically loaded from:
final_india.csv
Choose:
- State
- Primary metric (point size)
- Secondary metric (color)
- Log-scale option
- District search
Each district is shown as a point on the India map using:
- Size → selected primary metric
- Color → selected secondary metric
- Key performance indicators (KPIs)
- Top 10 districts bar chart
- Filtered data preview
| Component | Technology |
|---|---|
| Dashboard | Streamlit |
| Plots | Plotly Express |
| Data Processing | Pandas, NumPy |
| Map Tiles | Mapbox (OpenStreetMap style) |
- Add choropleth maps using district GeoJSON
- Support multiple census years
- Add download/export options
- Add scatter comparison (primary vs secondary)
- Dark mode UI
MIT License — you are free to use and modify the code.
Cursed027