End-to-end data pipeline for real-time cryptocurrency market intelligence
This project implements an end-to-end data pipeline for real-time cryptocurrency data. It scrapes cryptocurrency market data every 15 minutes, processes and loads it into PostgreSQL, transforms it with DBT, and visualizes trends in Power BI dashboards.

- Scrapes
title,prefix,price,24h change,volume,market cap - Runs every 15 minutes
- Cleans values (
$,%,M,B) → numeric format
crypto_currencies→ latest snapshotcrypto_currencies_old→ previous snapshot- Ensures historical tracking of prices
- Combines
crypto_currencies+crypto_currencies_old - Produces a view with:
- Current Price
- Maximum Price
- Minimum Price
- Market Cap, Volume, 24h Change
- Connects to DBT view
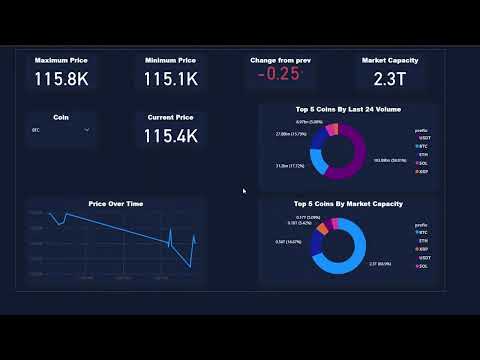
- Dashboards include:
- Current market snapshot
- Historical price highs/lows
- Trends over time
- Docker installed with proper configurations
- PostgreSQL database setup
- Database Setup: Create PostgreSQL database using
create_schema.sqlfile - Docker Configuration: Ensure all files and folders are mounted in Docker with correct configs
- AI Assistant: Share the
DAG.pyfile with any AI for detailed instructions - Testing Only: To test scraping mechanism only, run the
Scrape.pyscript
- Snapshot View → Current market prices, volumes, caps
- Trend Analysis → Min/max price tracking across time

Click to watch the complete project walkthrough
| Achievement | Description |
|---|---|
| 🔄 Automated Pipeline | Built end-to-end automated data processing system |
| ⏰ Real-time Monitoring | Enables continuous cryptocurrency market tracking |
| 📚 Historical Data | Preserves complete price history for trend analysis |
| 📊 Business Intelligence | Provides insightful dashboards for decision-making |
Built with modern data engineering practices for cryptocurrency market intelligence