Use these resources to answer the questions below, then pick an open-ended question to explore further:

⚾ Initial Questions ⚾
My answers with code can be found here, or by clicking each question below.
1. What range of years does the provided database cover?
SELECT MAX(f.yearid) --Use MIN for earliest
  FROM people p
       INNER JOIN pitching i
       ON p.playerid = i.playerid
       INNER JOIN batting b
       ON p.playerid = b.playerid
       INNER JOIN fielding f
       ON p.playerid = f.playerid
2. Find the name and height of the shortest player in the database. How many games did he play in? What is the name of the team for which he played?
SELECT height, namefirst, namelast, debut, finalgame, b.teamid
  FROM people p
       INNER JOIN batting b
       ON p.playerid = b.playerid
 WHERE height =
       (SELECT MIN(height) FROM people)
3. Find all players in the database who played at Vanderbilt University. Create a list showing each player’s first and last names as well as the total salary they earned in the major leagues. Sort this list in descending order by the total salary earned. Which Vanderbilt player earned the most money in the majors?
| Earnings | schoolname | namefirst | namelast |
|---|---|---|---|
| $245,553,888 | Vanderbilt | David | Price |
| $62,045,112 | Vanderbilt | Pedro | Alvarez |
| $21,500,000 | Vanderbilt | Scott | Sanderson |
| $20,512,500 | Vanderbilt | Mike | Minor |
| $16,867,500 | Vanderbilt | Joey | Cora |
| $12,800,000 | Vanderbilt | Mark | Prior |
| $12,183,000 | Vanderbilt | Ryan | Flaherty |
| $7,920,000 | Vanderbilt | Josh | Paul |
| $4,627,500 | Vanderbilt | Sonny | Gray |
| $4,188,836 | Vanderbilt | Mike | Baxter |
| $3,702,000 | Vanderbilt | Jensen | Lewis |
| $3,180,000 | Vanderbilt | Matt | Kata |
| $2,000,000 | Vanderbilt | Nick | Christiani |
| $1,154,400 | Vanderbilt | Jeremy | Sowers |
| $540,000 | Vanderbilt | Scotti | Madison |
SELECT SUM(sa.salary) AS dough,
       s.schoolname, p.namefirst, p.namelast
  FROM schools s
       INNER JOIN collegeplaying c
       ON s.schoolid = c.schoolid
	  INNER JOIN people p
       ON p.playerid = c.playerid
	  INNER JOIN salaries sa
       ON p.playerid = sa.playerid
 WHERE LOWER(s.schoolname) LIKE '%vanderbilt%'
 GROUP BY namefirst, namelast, s.schoolname
 ORDER BY dough DESC
4. Find the average number of strikeouts per game by decade since 1920. Round the numbers you report to 2 decimal places. Do the same for home runs per game. Do you see any trends?
| Average HR per game | Average Strikeouts per game | Decade |
|---|---|---|
| 0.8 | 5.63 | 1920 |
| 1.09 | 6.63 | 1930 |
| 1.05 | 7.1 | 1940 |
| 1.68 | 8.8 | 1950 |
| 1.65 | 11.39 | 1960 |
| 1.49 | 10.3 | 1970 |
| 1.61 | 10.69 | 1980 |
| 1.91 | 12.27 | 1990 |
| 2.15 | 13.12 | 2000 |
| 1.97 | 15.04 | 2010 |
WITH hr_per_year AS
     (SELECT yearid, SUM(HR) AS total_hr, SUM(HRA)
        FROM teams
       WHERE yearid >= '1920'
       GROUP BY yearid),
     total_games_per_year AS
     (SELECT yearid, SUM(g) / 2 AS total_games
        FROM teams
       WHERE yearid >= '1920'
       GROUP BY yearid),
     total_so_per_year AS
     (SELECT yearid, SUM(so) AS total_strikeouts FROM teams
       WHERE yearid >= '1920'
       GROUP BY yearid)

SELECT DISTINCT ROUND(AVG(hr_per_game)
       OVER(PARTITION BY decade), 2) AS avg_hr_per_game,
       ROUND(AVG(so_per_game)
       OVER(PARTITION BY decade), 2) AS avg_so_per_game,
	  decade
  FROM (SELECT
       ROUND(CAST(h.total_hr / CAST(t.total_games AS float) AS numeric), 2)
       AS hr_per_game,
 ROUND(CAST(s.total_strikeouts / CAST(t.total_games AS float) AS   numeric), 2) AS so_per_game,
	 (10 * DATE_PART('decade', TO_DATE(h.yearid::text, 'YYYY'))) AS decade
  FROM hr_per_year h
       INNER JOIN total_games_per_year t
       ON h.yearid = t.yearid
	  INNER JOIN total_so_per_year s
	  ON h.yearid = s.yearid) AS foo
 ORDER BY decade
5. Find the player who had the most success stealing bases in 2016, where success is measured as the percentage of stolen base attempts which are successful. Consider only players who attempted at least 20 stolen bases.
SELECT 100 * (sb / (sb + cs)::float) AS stolen_base_pct,
       p.namefirst, p.namelast, sb, cs
  FROM batting b
       INNER JOIN people p
       ON p.playerid = b.playerid
 WHERE b.yearid = '2016' and sb + cs >= 20
 ORDER BY stolen_base_pct
6. From 1970 – 2016, what is the largest number of wins for a team that did not win the world series? What is the smallest number of wins for a team that did win the world series? Doing this will probably result in an unusually small number of wins for a world series champion. Determine why this is the case, then redo your query excluding the problem year. How often from 1970 – 2016 was it the case that a team with the most wins also won the world series? What percentage of the time?
SELECT yearid, name, /*MIN*/MAX(w)FROM teams
 WHERE yearid >= 1970
   AND yearid <> 1981
   AND wswin = 'N' /*'Y'*/
 GROUP BY yearid, name
 ORDER BY /*MIN*/MAX(w) DESC;

WITH sub AS
     (SELECT distinct yearid, MAX(w)
        OVER (PARTITION BY yearid) AS top_wins
        FROM teams
       WHERE yearid >= 1970 ORDER BY yearid)

SELECT
	 (SELECT COUNT(*)
         FROM teams t
              INNER JOIN sub s
              ON t.yearid = s.yearid
        WHERE top_wins = w
              AND t.wswin = 'Y') /
	 (SELECT COUNT(*)
         FROM teams t
              INNER JOIN sub s
              ON t.yearid = s.yearid
        WHERE top_wins = w)::float
7. Using the attendance figures from the homegames table, find the teams and parks which had the top 5 average attendance per game in 2016. Only consider parks where there were at least 10 games played. Report the park name, team name, and average attendance. Repeat for the lowest 5 average attendance.
| team | park_name | avg_attend |
|---|---|---|
| Top | ||
| LAN | Dodger Stadium | 45719.9 |
| SLN | Busch Stadium III | 42524.6 |
| TOR | Rogers Centre | 41877.8 |
| SFN | AT&T Park | 41546.4 |
| CHN | Wrigley Field | 39906.4 |
| Bottom | ||
| TBA | Tropicana Field | 15878.6 |
| OAK | Oakland-Alameda County Coliseum | 18784.0 |
| CLE | Progressive Field | 19650.2 |
| MIA | Marlins Park | 21405.2 |
| CHA | U.S. Cellular Field | 21559.2 |
SELECT team, h.park, p.park_name,
       (attendance / games::numeric) AS avg_attend
  FROM homegames h
       INNER JOIN parks p
       ON h.park = p.park
 WHERE year = '2016'
       AND games >= 10
 ORDER BY avg_attend DESC --ORDER BY avg_attend ASC
 LIMIT 5
8. Which managers have won the TSN Manager of the Year award in both the National League (NL) and the American League (AL)? Give their full name and the teams that they were managing when they won the award.
WITH al_awards AS
     (SELECT a.yearid AS al_year, m.teamid AS al_team, p.namefirst, p.namelast,
	   awardid AS al_award, a.playerid, a.lgid
 FROM managers m
      INNER JOIN awardsmanagers a
	    ON m.playerid = a.playerid
         AND m.yearid = a.yearid
         AND m.lgid = a.lgid
      INNER JOIN people p
      ON p.playerid = m.playerid
WHERE awardid = 'TSN Manager of the Year'
  AND a.lgid = 'AL'),

      nl_awards AS
      (SELECT a.yearid AS nl_year, m.teamid AS nl_team,                        	 p.namefirst, p.namelast, awardid AS nl_award,
      a.playerid, a.lgid
 FROM managers m
      INNER JOIN awardsmanagers a
	    ON m.playerid = a.playerid
         AND m.yearid = a.yearid
         AND m.lgid = a.lgid
      INNER JOIN people p
      ON p.playerid = m.playerid
WHERE awardid = 'TSN Manager of the Year'
  AND a.lgid = 'NL')

SELECT DISTINCT al_award, nl_award,
                al_year, nl_year,
                al_team, nl_team, a.namefirst, a.namelast
  FROM al_awards a
       INNER JOIN nl_awards n
       ON a.playerid = n.playerid
⚾ Open-ended question I chose to explore ⚾
It is thought that since left-handed pitchers are more rare, causing batters to face them less often, that they are more effective. Investigate this claim and present evidence to either support or dispute this claim. Determine just how rare left-handed pitchers are compared with right-handed pitchers. Are left-handed pitchers more likely to win the Cy Young Award? Are they more likely to make it into the hall of fame?
WITH pitchers AS
     (SELECT yearid, playerid, SUM(g) AS total_games
        FROM pitching
       GROUP BY playerid, yearid
	           HAVING SUM(g) > 10)

SELECT ROUND(
       (SELECT COUNT(*) as lefties
	     FROM people p
               INNER JOIN pitchers i
               ON p.playerid = i.playerid
	    WHERE throws = 'L') /

       (SELECT COUNT(*) as throws_r_l
          FROM people p
               INNER JOIN pitchers i
               ON p.playerid = i.playerid
	    WHERE throws in ('L', 'R'))
::numeric, 2) as pct;I explored deeper by incorporating pitching effectiveness and pitch movement data for left-handed and right-handed pitchers (2015 only) from fangraphs.com.
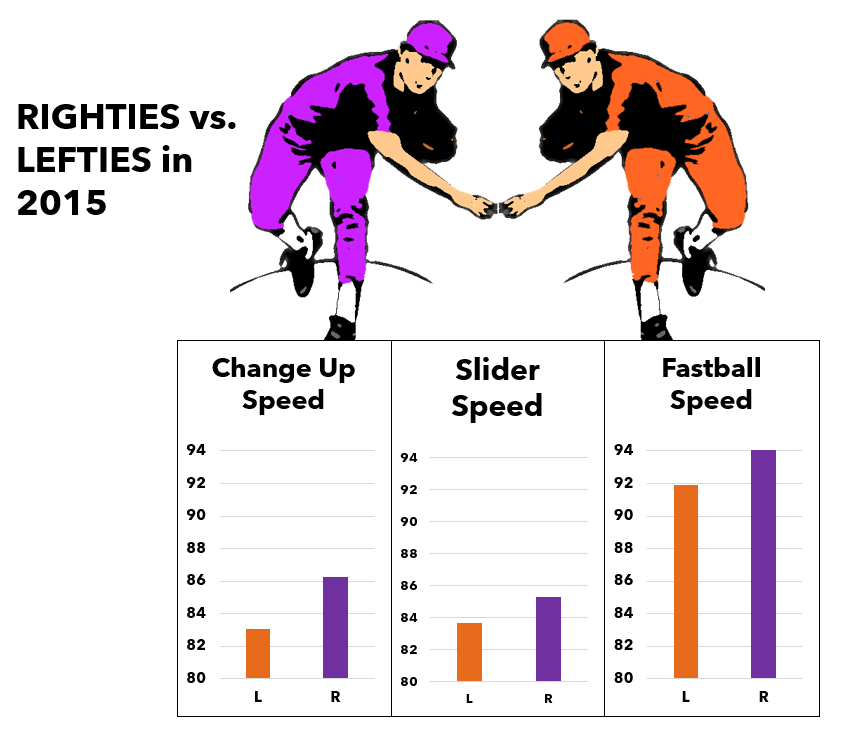
Southpaws (Lefties) trail behind their right-handed counterparts in the speed department. Speed is the most important measure of how hard a pitch is to hit.

However, left-handed pitchers seem to move the ball both vertically and horizontally at a greater rate than righties, at least in 2015. That said, this finding conflicts with the assessment of fivethirtyeight.com and other authorities on the subject, so more investigation may be warranted here.
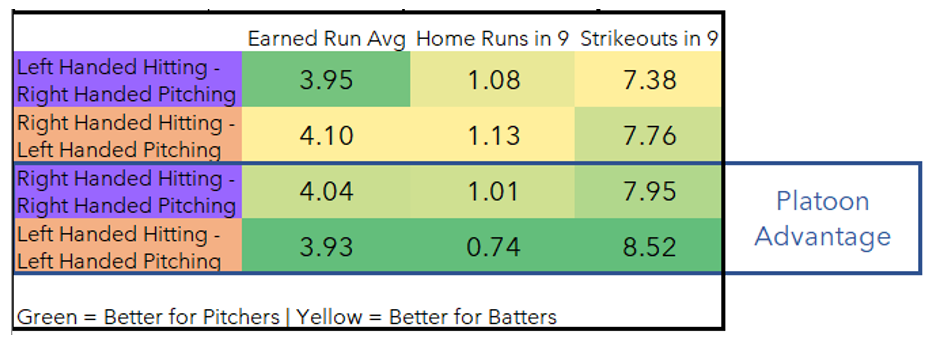
The 'platoon advantage' is a term for the inherent historical advantage that pitchers have against same-handed batters. (The corollary is the advantage batters have against other-handed pitchers.)
Here we can see the platoon advantage at work. Notably, lefties in 2015 allowed 0.34 fewer home runs per game when facing their own ilk! Unfortunately for them, since there are fewer left-handed batters than right-handed batters in the major leagues, the platoon advantage is a net detriment to them.
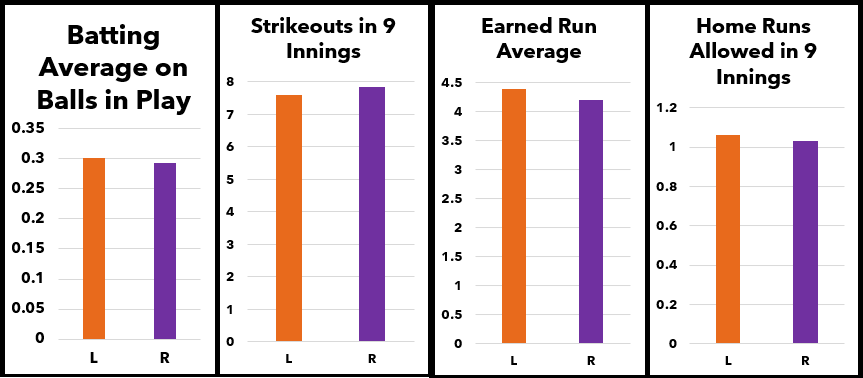
And in each of these important categories, you'll see that right-handed pitchers maintained an advantage. Opposing batters had a higher batting average, they hit more home runs, and they struck out less against lefties.
Despite their seeming ability to move the ball more, left-handers have a disadvantage in the speed department, and it seems this may be due to the fact that in the world there are simply far less individuals who naturally use their left hands, and therefore the talent pool is smaller. It would be interesting to explore further what proportion of lefties exist at lower levels of play to assess at what rate they succeed versus the proportion in the general population. Regional variation in the proportion of left-handers would also be interesting to examine. Is there a cultural component to handedness in baseball or other sports?