ITMoB Training Seminar Series #1: Modeling on Population Distribution Projection for Scenario Analysis
ITMoB launched a series of open online training seminars as an opportunity for technical capacity building. The first training seminar on population distribution modeling will be organized on 3rd September. The program is designed for researchers and students who want to obtain the modeling skills for scenario analysis on population distribution.
Date: 3rd September (Friday)
Time: 15:00-17:00 in Japan time(14:00-16:00 in Philippines time, 13:00-15:00 in Western Indonesian time)
Venue: Zoom (the link will be sent few days before to registered emails)
Language: English
Fee: Free
Information: https://supportoffice.jp/eAsia2021/events/
- 64 bit OS
- Windows 10
- Mac (Intel / M1)
- PC memory >= 8GB
- Storage >= 10GB
- R >= 4.0.0
- see, https://rstudio-education.github.io/hopr/starting.html
- download "R" and "R-studio" matching to the specification of your PC
- Excel >= 2010
Code & data (4.36 GB) is available from https://www.dropbox.com/sh/kg8p0jflkm6y08y/AAAspzmqFvpmUTKHqGTXuWbaa?dl=0
- download "R" and "R-studio" matching to the specification of your PC
- Follow the instruction of https://rstudio-education.github.io/hopr/starting.html
Even if you have any troubles to download R or R-studio, you can attend and see the demonstratrion in the second session!
- open 'file'.
- click 'Enable Content' at the SECURITY WARNING bar
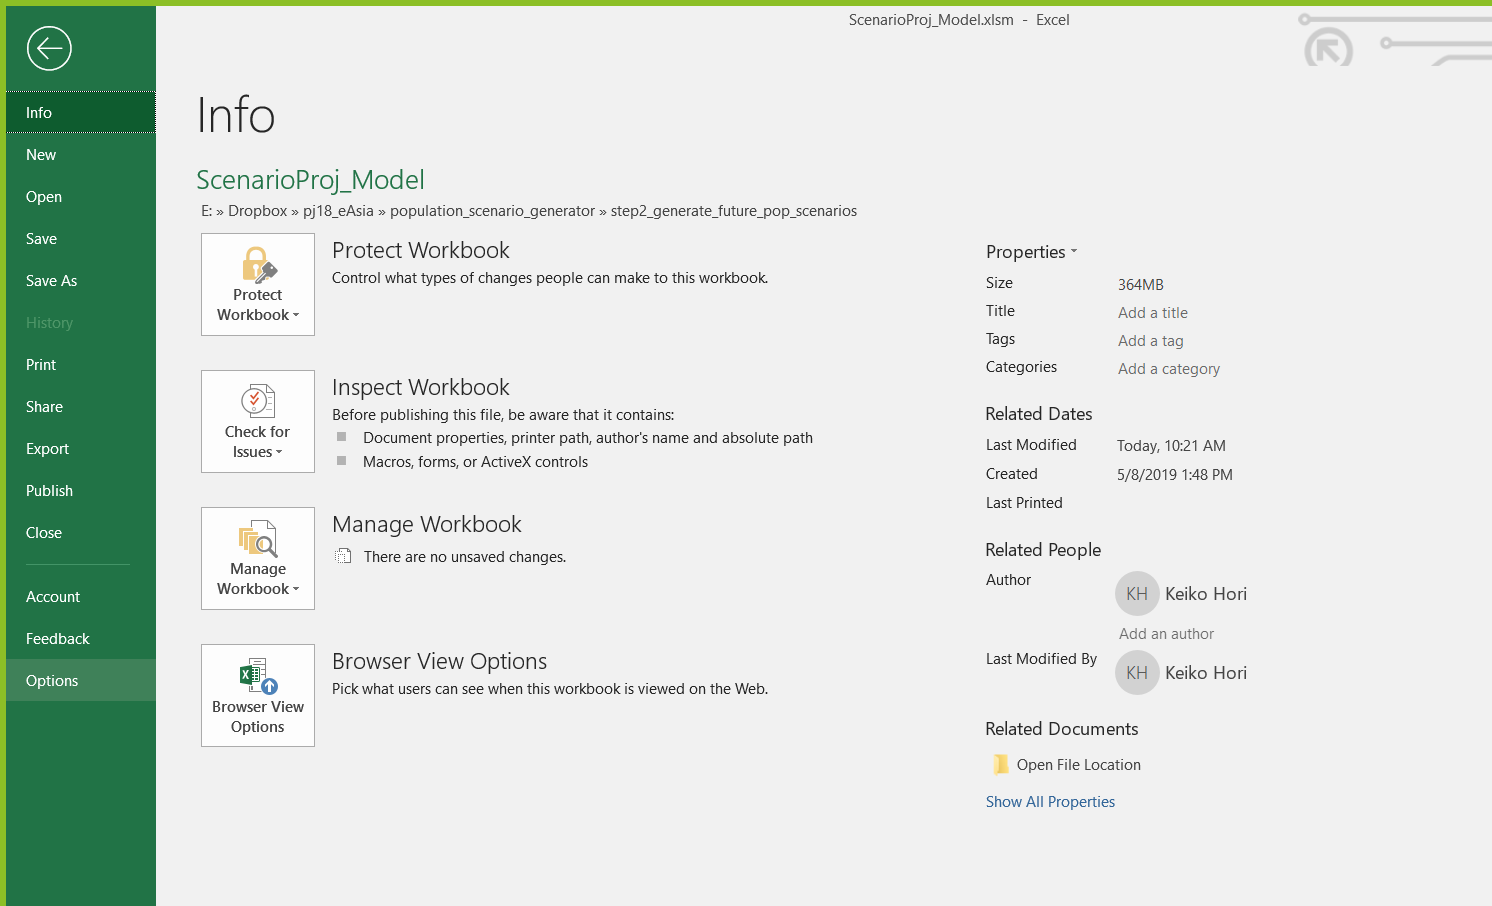
- go to 'File' tab -> select 'Options'
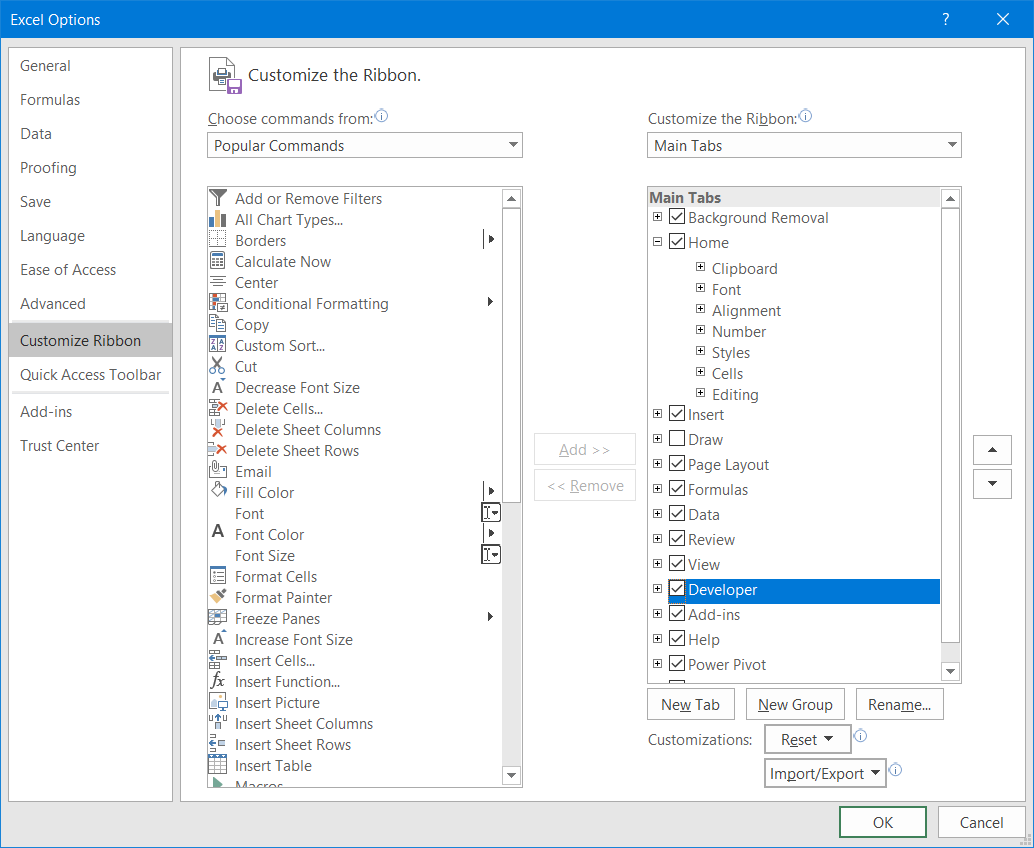
- go to "Customize Ribbon" -> check the ribbon named "Developer" in Main Tabs

- The 1st session
- 15:00-15:10 (JST) Opening remarks and introduction of e-Asia (Dr. Osamu Saito, IGES)
- 15:10-15:20 (JST) Population scenario development (Dr. Takanori Matsui, Osaka Univ.)
- 15:20-15:35 (JST) Development and application of gravity-based population allocation model (Dr. Chihiro Haga, Osaka Univ.)
- 15:40-15:55 (JST) Development and application of combined model by cohort-component method and gravity-based method (Dr. Keiko Hori, IGES)
- The 2nd session:Demonstration of scenario analysis on grid population
- 16:05-16:45 (JST) Scenario simulation of grid population by gravity model will be demonstrated
- 16:05-16:20 (JST) Step 1. Preprocessing population data (Dr.Haga)
- 16:20-16:35 (JST) Step 2. Calculate future population scenario (Dr.Hori & Dr.Haga)
- 16:35-16:45 (JST) Step 3. Visualize & compare scenarios (Dr.Haga)
- 16:05-16:45 (JST) Scenario simulation of grid population by gravity model will be demonstrated
- 16:55-17:00 (JST) Closing remarks(Dr. Osamu Saito)

15:00-15:10 (JST) Opening remarks and introduction of ITMoB e-Asia project (Dr. Osamu Saito, IGES) (https://orcid.org/0000-0002-0697-9593)
15:10-15:20 (JST) Population scenario development (Dr. Takanori Matsui, Osaka Univ.) (https://orcid.org/0000-0001-9441-7664)
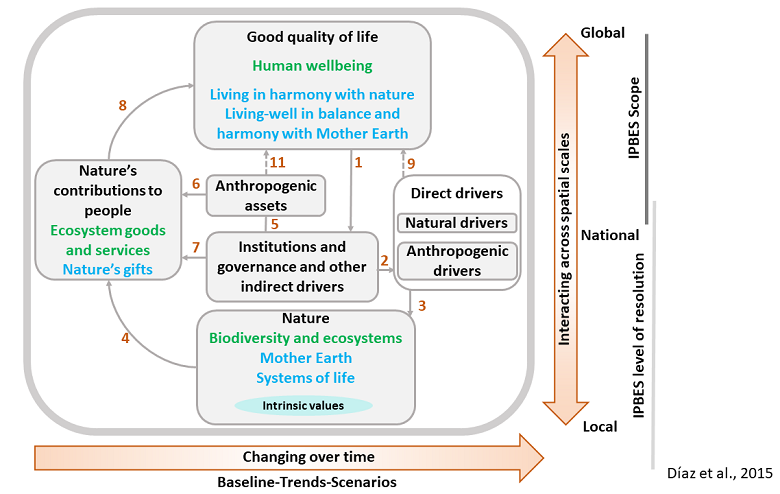
1. IPBES conceptual framework (https://ipbes.net/conceptual-framework)
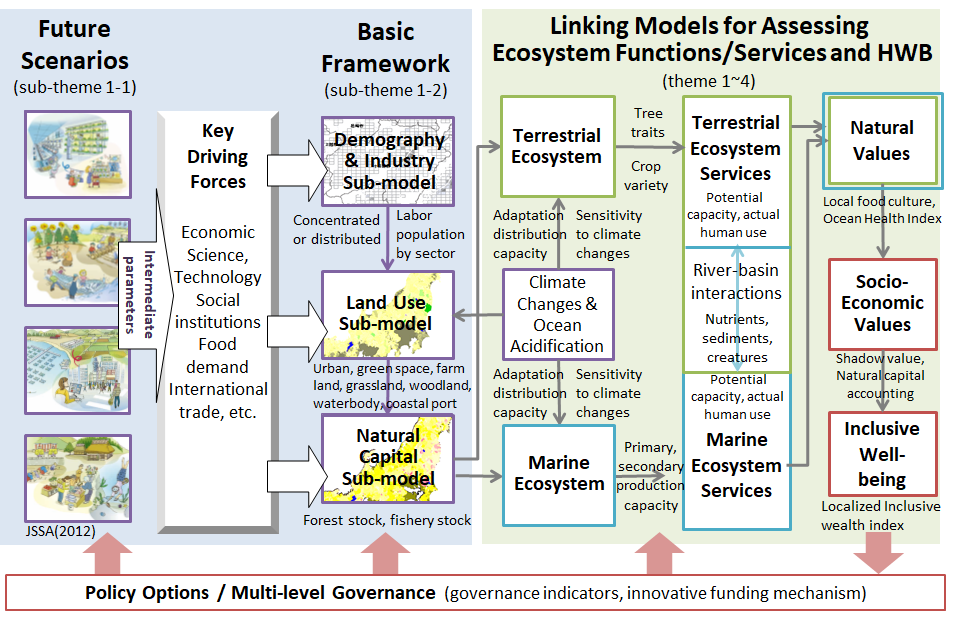
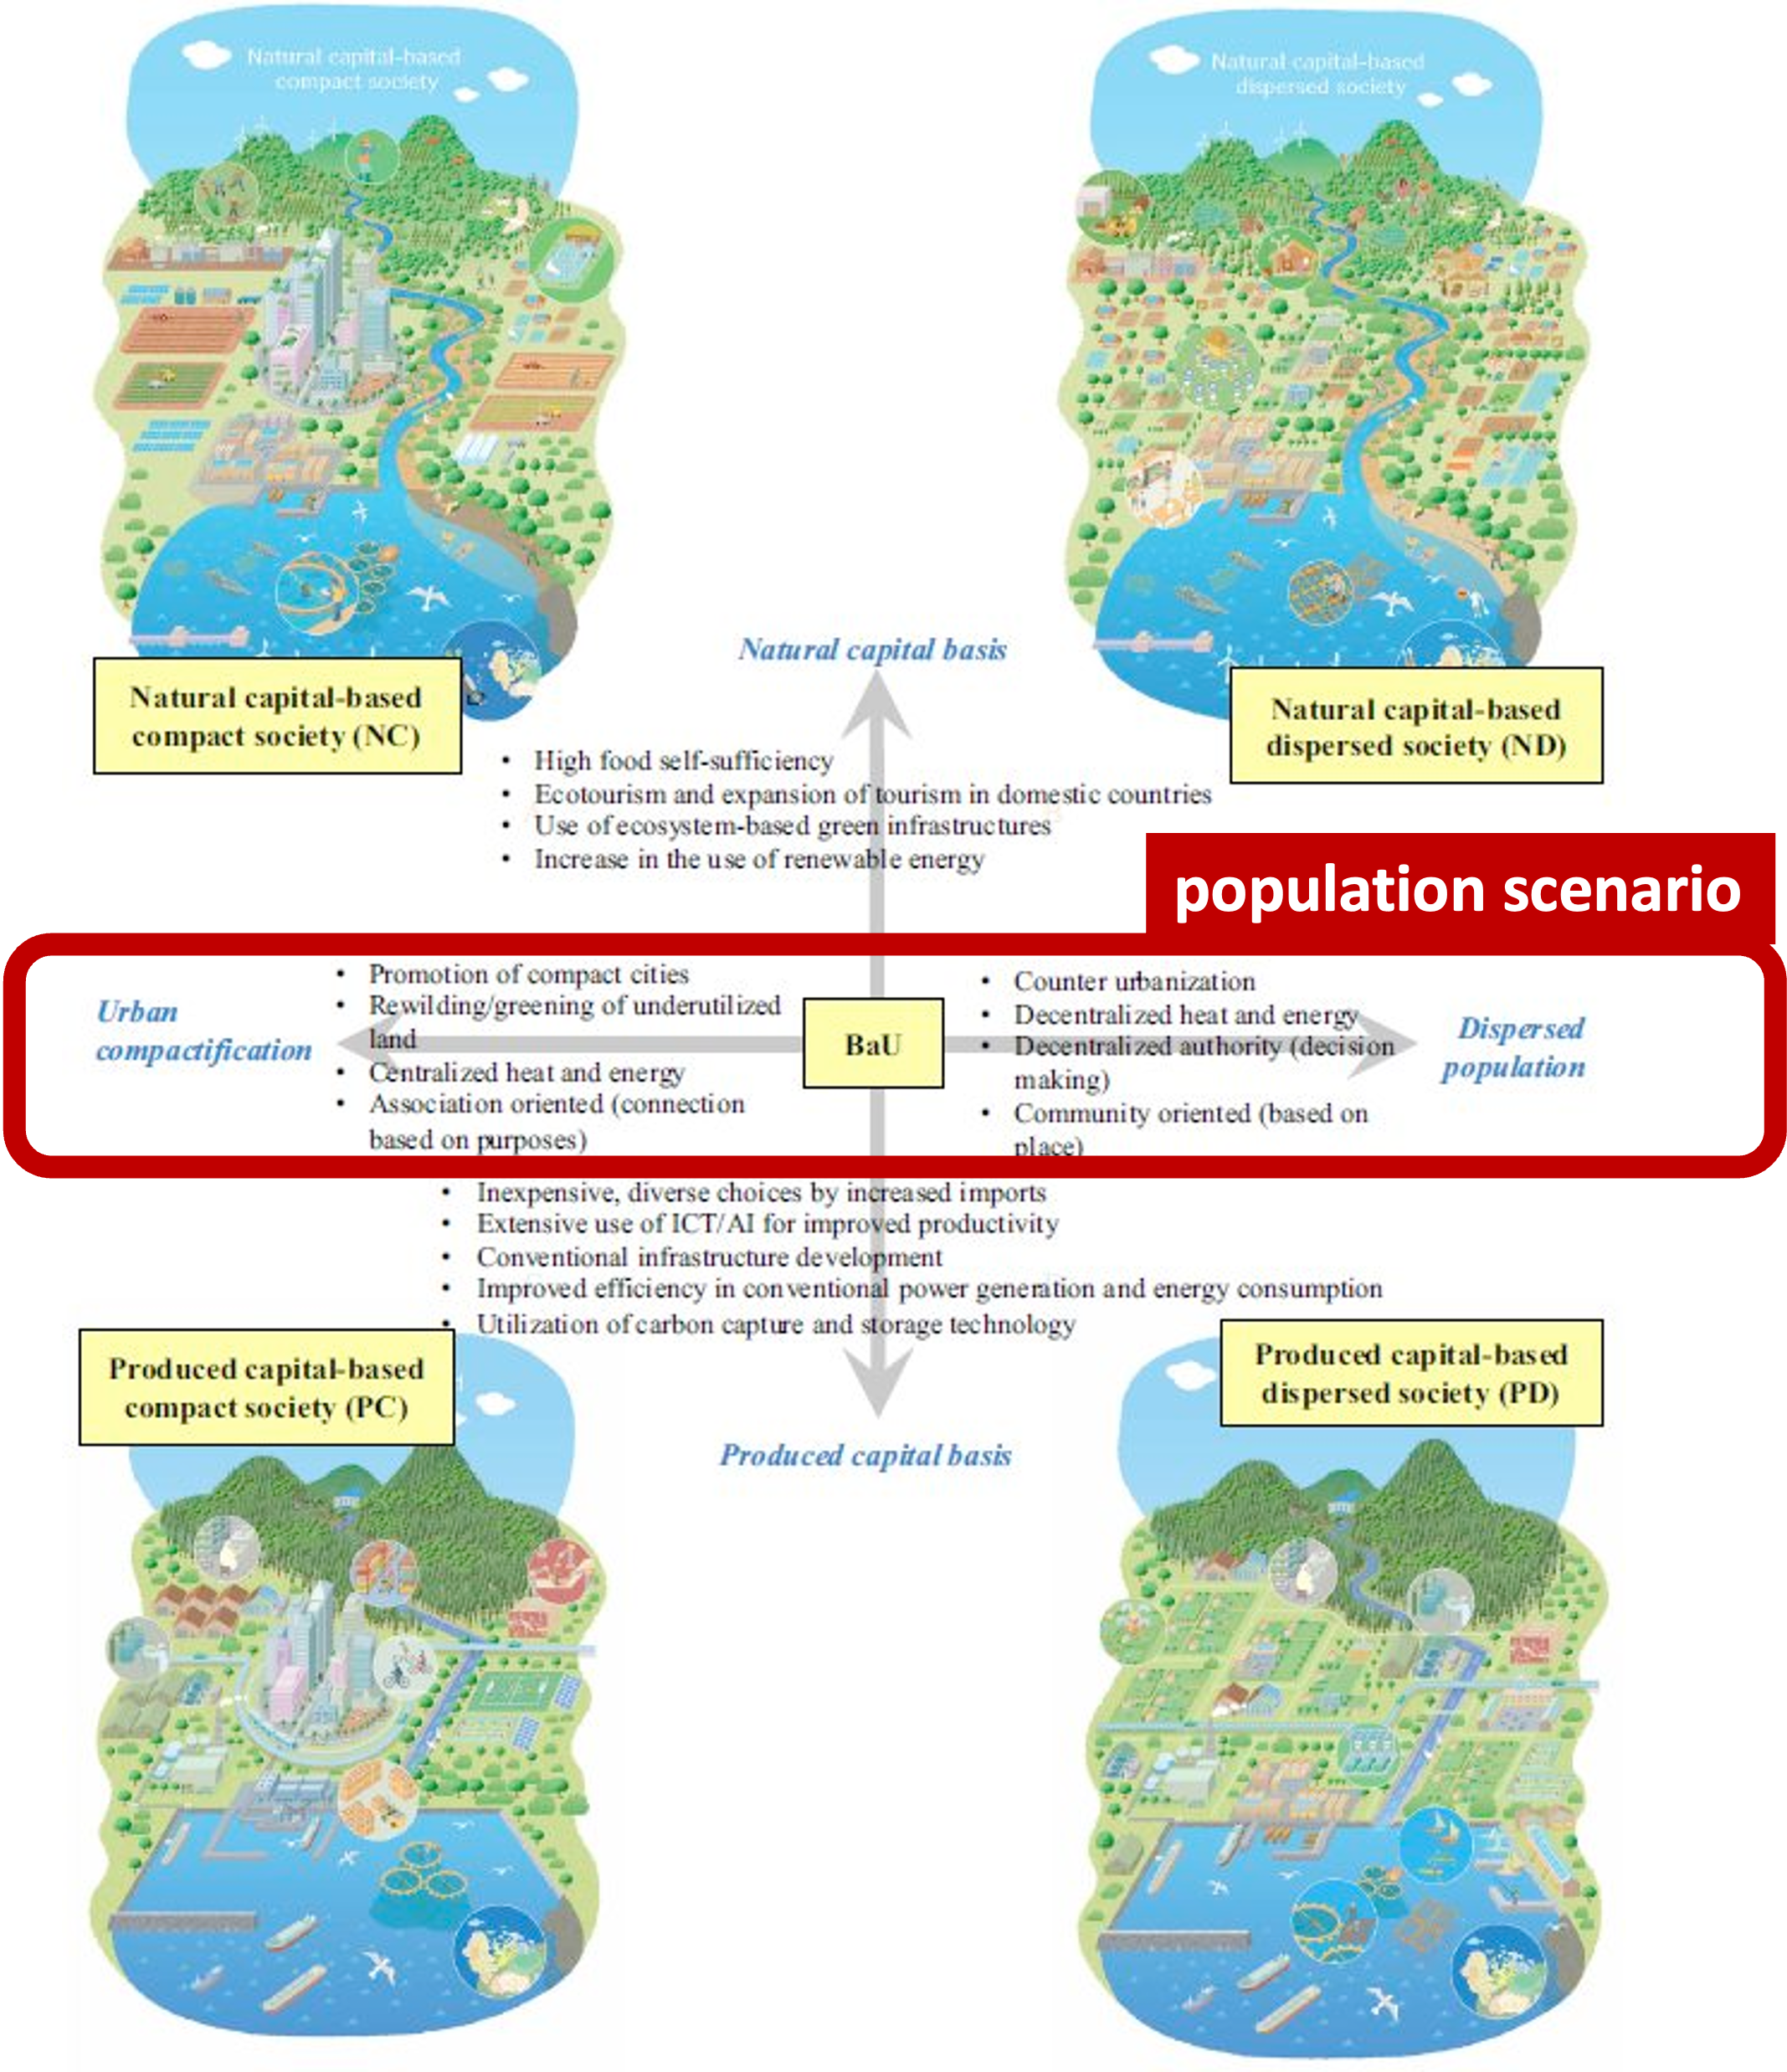
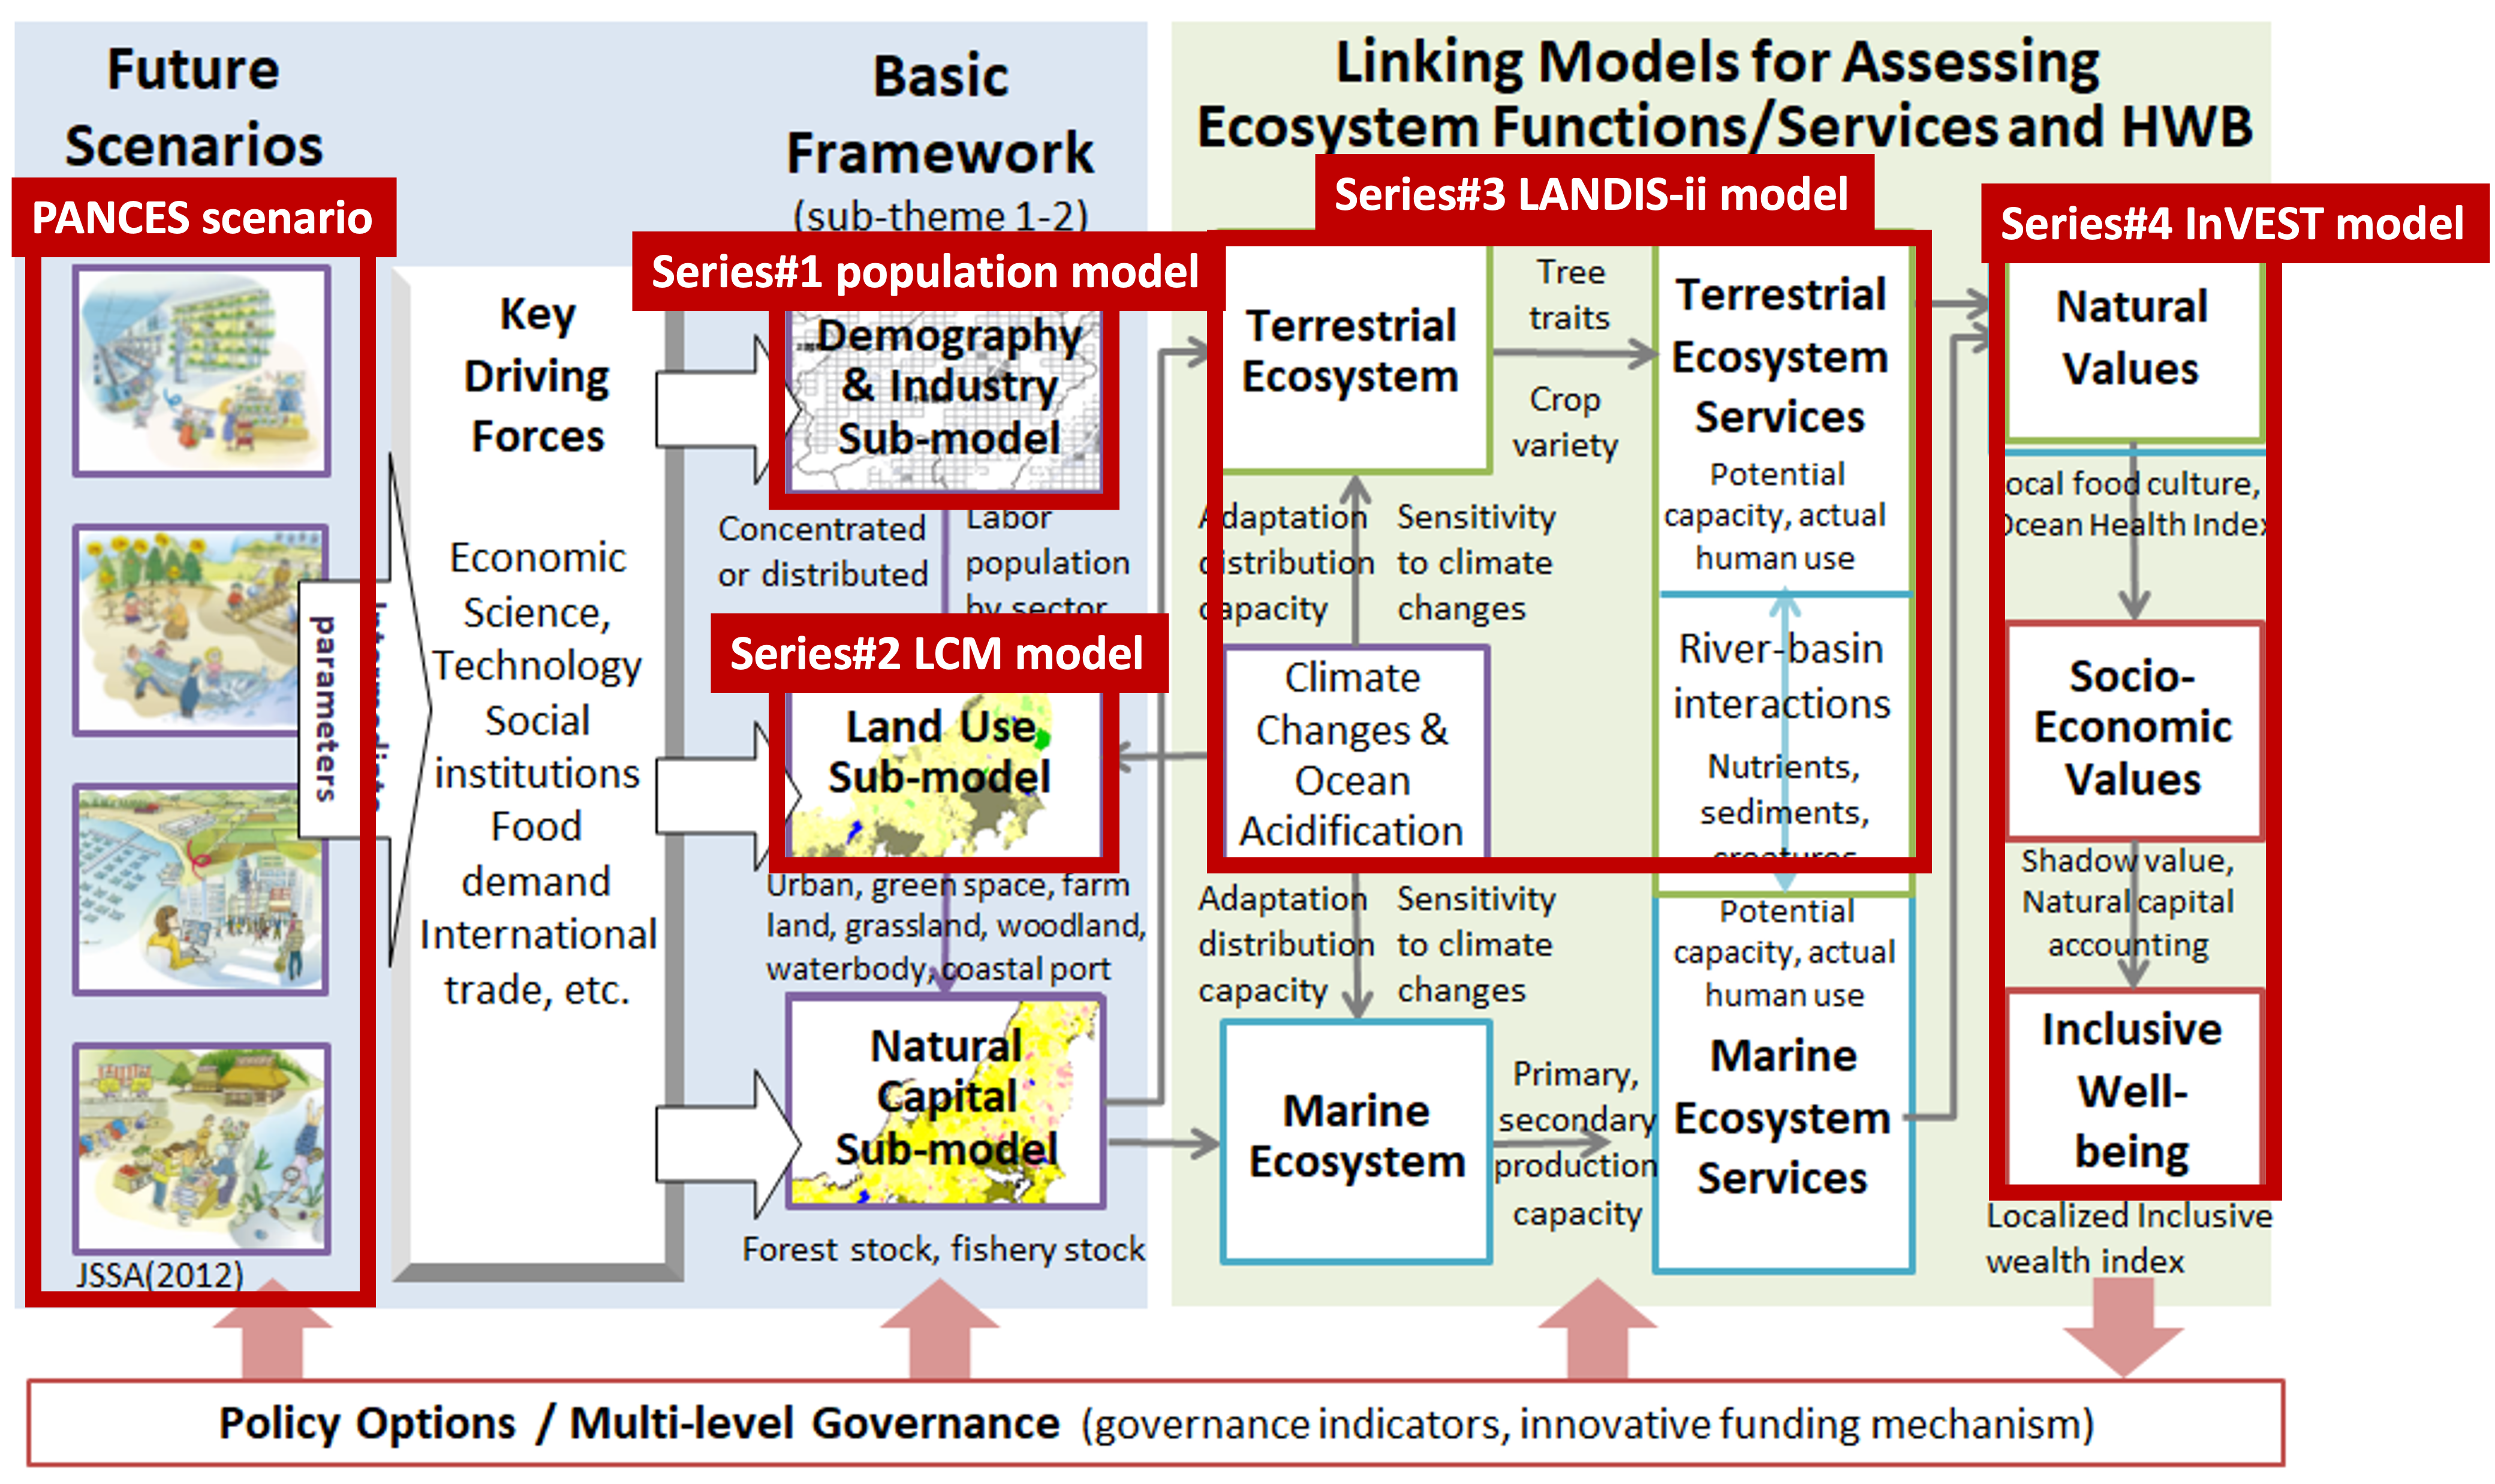
2. PANCES (Predicting and Assessing Natural Capital and Ecosystem Services)simulation system for describing socio-ecological systems (http://pances.net/eng/theme1.html)
3. PANCES scenarios (https://link.springer.com/article/10.1007/s11625-017-0475-8)
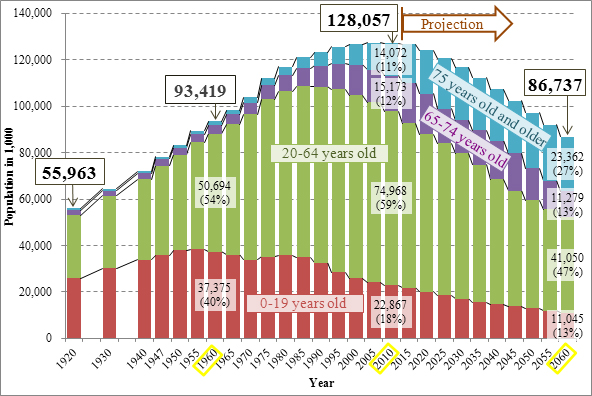
4. Population forecasting of Japan (http://www.ipss.go.jp/s-info/e/ssj2014/001.html)
- The simple population model from Dr. Chihiro Haga (https://orcid.org/0000-0002-3325-6315)

- The demographic dynamics model from Dr. Keiko Hori (https://www.researchgate.net/profile/Keiko-Hori-2)


15:20-15:35 (JST) Development and application of gravity-based population allocation model (Dr. Chihiro Haga, Osaka Univ.)
Source: https://link.springer.com/article/10.1007%2Fs11625-018-0605-y or preprint http://hdl.handle.net/11094/83603
Presentation material: Presentation_ChihiroHaga.pdf
- What is gravity-based approach?
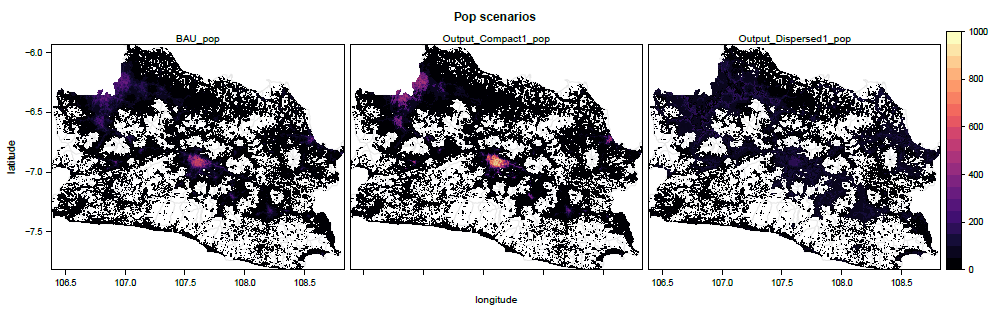
- Residential population distribution assumption of Compact & Dispersed scenarios
- Application: Overlay the future gridded population and socio-ecological status
15:40-15:55 (JST) Development and application of combined model by cohort-component method and gravity-based method (Dr. Keiko Hori, IGES)
Presentation material: Presentation_KeikoHori.pdf
- Multi step model structure combining cohort-component method and grabity model
- Detailed mathematical algorithm and scenario assumption of each step
- Application: Overlay analysis on the future land use maps
Simulated experience will be provided for participants by shared dataset and codes. Indonesian data will be used as sample data for the demonstration.
- Data:
- Unconstrained age and sex structures in 2020 provided by WorldPop
- Citation: WorldPop (www.worldpop.org - School of Geography and Environmental Science, University of Southampton; Department of Geography and Geosciences, University of Louisville; Departement de Geographie, Universite de Namur) and Center for International Earth Science Information Network (CIESIN), Columbia University (2018). Global High Resolution Population Denominators Project - Funded by The Bill and Melinda Gates Foundation (OPP1134076). https://dx.doi.org/10.5258/SOTON/WP00646
- Built-settlement extents, Indonesia provided by WorldPop
- Citation: WorldPop (www.worldpop.org - School of Geography and Environmental Science, University of Southampton; Department of Geography and Geosciences, University of Louisville; Departement de Geographie, Universite de Namur) and Center for International Earth Science Information Network (CIESIN), Columbia University (2018). Global High Resolution Population Denominators Project - Funded by The Bill and Melinda Gates Foundation (OPP1134076). https://dx.doi.org/10.5258/SOTON/WP00649
- Constrained vs Unconstrained?
- Unconstrained age and sex structures in 2020 provided by WorldPop
- Processing in R & Rstudio
- Install & Load libraries
- Initialize parameters
- Read province & builtup area maps (in step1_preprocessing_pop/data folder)
- Iterate for each age & sex category
- Read population data (in step1_preprocessing_pop/data/idn_westjawa folder)
- Mask the population data within the west jawa province
- Remove non-residential area
- Compute proportion
- Save the raster data as dataframe in CSV format
- Merge all CSVs into one CSV file (./output/step1_output_westjawa_cohort_data.csv)
- For more technical tutorials, visit the following websites.
- Learning R and Rstudio https://education.rstudio.com/learn/beginner/
- Spatial Data Science with R, see https://rspatial.org/ and https://cran.r-project.org/web/packages/raster/raster.pdf
- our tutorial use "raster" package not "terra" package
- Data: projected 2045 population of West Jawa province by age groups and sex provided by Indonesia Population Projection 2015-2045
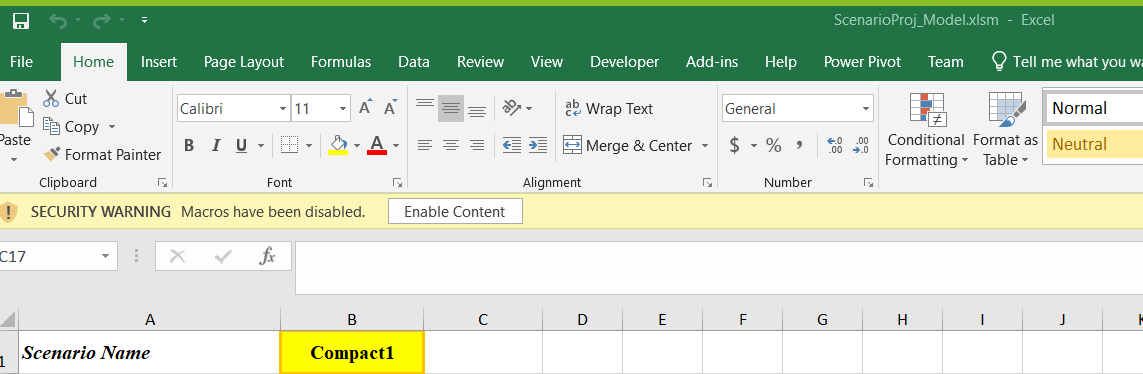
- Open the Excel file named ScenarioProj_Model in step2_generate_future_pop_scenarios folder
- Click 'Enable Content' at the SECURITY WARNING bar
- Input arbitrary scenario name and parameters (γ and δ) at sheets ParameterSetting_Compact and ParameterSetting_Dispersed
- Push the button "Run" and wait few minutes (!!Don't touch anything until the calculation stop!!)
- Push the button "BAU allocater"
- Check the CSV files made at the folder csv with holding the scenario names
- You can find many tutorials to learn VBA more, such as https://www.tutorialspoint.com/vba/index.htm, https://www.guru99.com/vba-tutorial.html
- Processing in R & Rstudio
- Install & Load libraries
- Initialize parameters
- Read the province map
- Iterate for each scenario
- Read the calculated population scenario from excel file (step2_generate_future_pop_scenarios/ScenarioProj_Model.xlsm)
- Add longitude & latitude information
- Rasterize the future population data
- Save the raster data
- Visualize the raster data using R / GIS software